


Australian Dollar, AUD/USD, RBA, Momentum, Fibonacci - Talking Points
- AUD/USD appears vulnerable as the US Dollar remains strong
- The move lower arrives just before a crucial RBA meeting that could add volatility
- If bearish momentum continues to unfold, how low will AUD/USD go?

The Australian Dollar made a 2-year low to end last week as bearish momentum appeared to pick up steam.
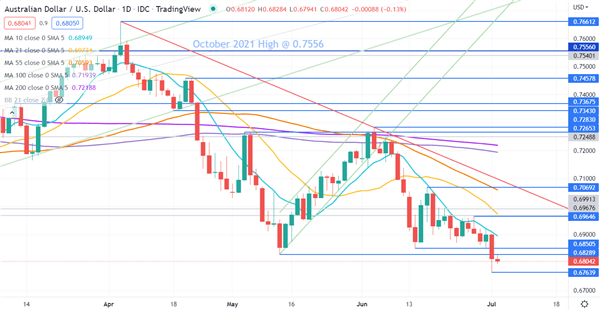
A bearish triple moving average (TMA) formation requires the price to be below the short term simple moving average (SMA), the latter to be below the medium term SMA and the medium term SMA to be below the long term SMA. All SMAs also need to have a negative gradient.
Looking at the 10-, 21-, 55-, 100- and 200-day SMAs, AUD/USD met the criteria for a bearish TMA in the middle of June.
It may signal that bearish momentum could continue to evolve. If the price moves back above the 10-day SMA, the TMA will no longer be valid.
Support may lie at Friday’s low of 0.6764. The previous lows 0.6829 and 0.6850 might offer break point resistance.
The RBA monetary policy committee meeting on Tuesday might provide event risk volatility opportunities. The market is anticipating a 50 basis points (bps) hike and anything other than that could see a significant move.
If they hike by less than 50 bps it could see the support levels tested and a break below them might see a continued run lower. Conversely, a hike by more than 50 bps might see resistance levels challenged and if they are overcome, we may have seen the low for the medium term last week.
AUD/USD DAILY CHART
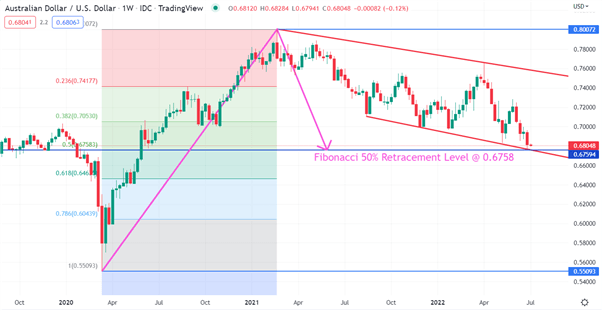
AUD/USD WEEKLY CHART
Last week's push lower stopped just above the 50% Fibonacci Retracement level at 0.6758 to make a low of 0.6764. This Fibonacci level may continue to provide support.
The bigger picture highlights that since the February 2021 peak of 0.8007, the price has made lower highs and lower lows, revealing descending trend lines above and below the price.
The lower trend line that currently dissects the price at 0.6748 is under threat and a break below there could indicate further bearishness is unfolding.
--- Written by Daniel McCarthy, Strategist for DailyFX.com
To contact Daniel, use the comments section below or @DanMcCathyFX on Twitter


