


Japanese Yen, USD/JPY, US Dollar, Momentum, Volatility, Options- Talking Points
- USD/JPY has made new highs but failed to run on with it so far
- Momentum signals appear to have rejuvenated bulls to push up
- The pause in Yen weakening might over, will USD/JPY go higher?
Introduction to Technical Analysis
Learn Technical Analysis
Recommended by Daniel McCarthy
USD/JPY
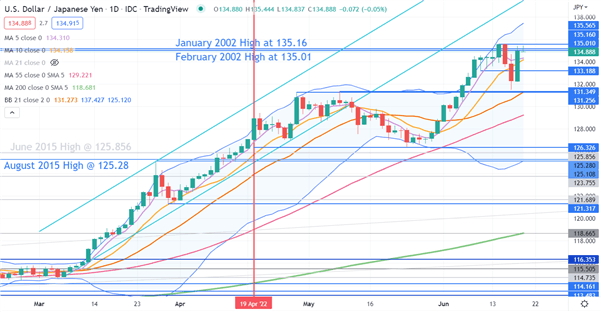
USD/JPY made a 24-year high last week, breaking above the 2002 peak and trading as high as 135.57. The price is now testing that recent high as momentum signals appear to have been re-awakened.
A bullish triple moving average (TMA) formation requires the price to be above the short term simple moving average (SMA), the latter to be above the medium term SMA and the medium term SMA to be above the long term SMA. All SMAs also need to have a positive gradient.
Looking at USD/JPY, any combination of the 5-, 10-, 21-, 55- and 200-day SMAs meets the criteria for a bullish TMA.
Near term support may lie at the 5- and 10-day SMAs, currently near 134.30 and 134.15 respectively. A move below these SMAs could see short-term bullish momentum pause.
Further down, support may lie at the break points in the 131.25 – 131.35 area. The 21-day SMA is also in this zone and might lend support. Those levels held last week when the price made a low of 131.49 before rallying.

The market might be preparing for a higher USD/JPY with volatility increasing as illustrated by the width of the 21-day SMA based Bollinger Band s.
Bolling Bands measure historical volatility and display a two standard deviation reading around a SMA.
The options market prices implied (future) volatility and represents the cost of insuring against adverse currency movements (or that of any asset) . The cost of the option is priced from the implied volatility that is determined by market forces and expressed as a percentage.
The benchmark 1-month volatility price spent most of 2021 trading in a range of 5 – 8%. It has been climbing since March, and hit a 2-year high last week near 16%.
This could indicate that markets are nervous about future USD/JPY price movements and are willing to pay more to hedge their risks.

--- Written by Daniel McCarthy, Strategist for DailyFX.com
To contact Daniel, use the comments section below or @DanMcCathyFX on Twitter


