


Euro, EUR/USD, US Dollar, EUR/JPY, Japanese Yen - Talking points
- EUR/USD makes lower lows while momentum has mixed messages
- EUR/JPYrally sees multi-year peaks breached on unfolding momentum
- Euro diverges between USD and JPY. Do they have further to play out?

EUR/USD TECHNICAL OUTLOOK
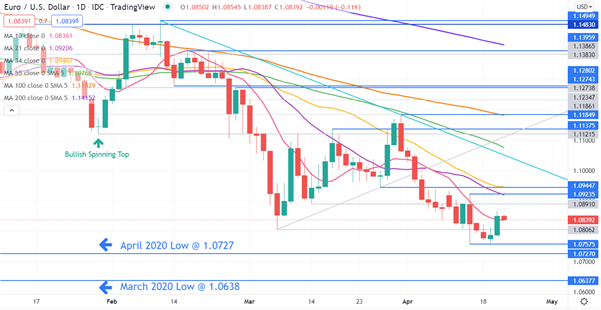
Last week, EUR/USD broke below last month’s low of 1.0806 and made a new 2-year low at 1.0758, which may now provide support.
The early 2020 lows of 1.0727 and 1.0638 lie just below there and might also be support.
This week, EUR/USD has rallied back above the 10-day simple moving average (SMA) and this could indicate that short-term bearish momentum is stalling for now.
The 21-, 34-, 55, 100- and 200-day SMAs all lie above the price and have negative gradients. This may denote medium and bearish momentum is still intact for now.
The 21-, 34- and 100-day SMAs currently align near potential resistance levels at 1.0924, 1.0945 and 1.1185 respectively, which might add significance to these levels.
A descending trend line currently intersects at 1.1050 and the 55-day SMA is just above there at 1.1077. Those levels could offer a resistance zone.
Introduction to Technical Analysis
Learn Technical Analysis
Recommended by Daniel McCarthy
EUR/JPY TECHNICAL ANALYSIS
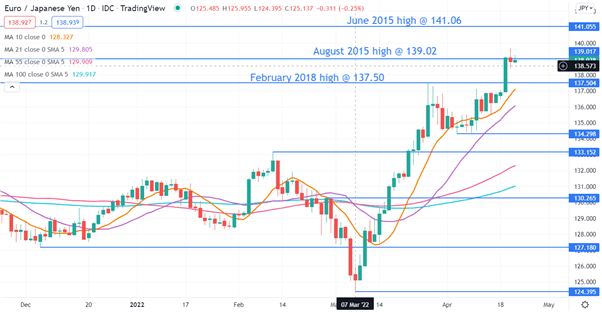
EUR/JPY has a very different picture to EUR/USD. Yen weakness has been seen across the board and EUR/JPY has made a new 6.5 year high this week.
While EUR/JPY broke above the August 2015 high of 139.02, it has struggled to hold above that price and it may unfold to be pivotal for future direction. The June 2015 peak of 141.06 could offer resistance.
Bullish momentum might have re-asserted itself with the slope of the 10-day simple moving average (SMA) steepening again after a week or so of flatlining.
All short, medium and long term SMAs exhibit positive gradients and are in climbing order of their tenures for potential bullish momentum to evolve.
An ascending trendline may provide support, currently intersecting at 138.90. Previous resistance levels could now provide support at 137.50 and 137.13. The latter is also currently at the same price at as the 10-day SMA.
Below there, the prior lows of 135.52 and 134.30 might also provide support.
Trade Smarter - Sign up for the DailyFX Newsletter
Receive timely and compelling market commentary from the DailyFX team
--- Written by Daniel McCarthy, Strategist for DailyFX.com
To contact Daniel, use the comments section below or @DanMcCathyFX on Twitter


