


Indian Rupee, USD/INR, Nifty 50, Technical Analysis - Talking Points
- The Indian Rupee has been appreciating, but it faces key levels ahead
- USD/INR Falling Wedge in focus, will the broader uptrend resume?
- This is as the Nifty 50 Index has been rising, now facing key resistance

Indian Rupee Technical Analysis
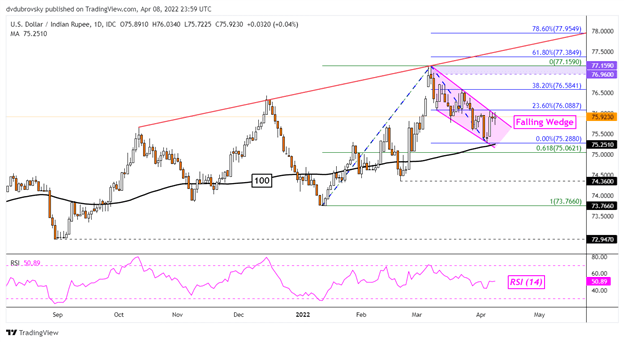
The Indian Rupee has been on the offensive against the US Dollar since March. Now, USD/INR is facing its next key test to resume the near-term downtrend. A bullish Falling Wedge chart pattern seems to be brewing. A breakout above could open the door to extending the broader uptrend since 2021. This is as prices were unable to pierce through the 100-day Simple Moving Average.
Immediate resistance seems to be the 23.6% Fibonacci extension at 76.088, with the 38.2% level above at 76.584. Clearing the latter would then expose the all-time high at 77.159. In the event of a turn lower, immediate support seems to be the 100-day SMA. Falling under the latter exposes the February low at 74.36 before the current-year low comes into focus at 73.766.
USD/INR Daily Chart
Nifty 50 Technical Analysis
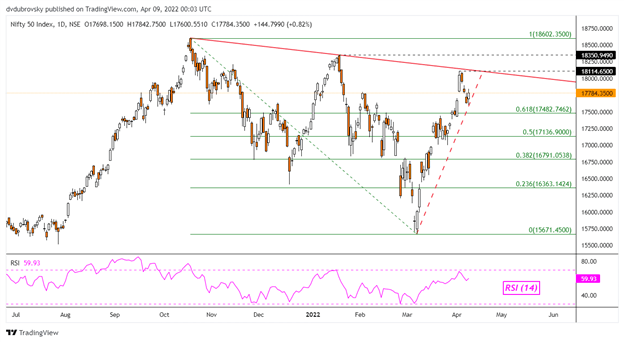
Unsurprisingly, accompanying gains in the Rupee has been a push higher in India’s benchmark stock index, the Nifty 50. It is up over 13% since finding a bottom in early March, guided higher by a rising trendline from then. Now, the index faces its next key test, a falling trendline from October 2021. Confirming a breakout above the latter may open the door to extending gains to the all-time high.
Getting there entails clearing the current 2022 peak at 18350. Still, a breakout under the rising trendline risks opening the door to a turn lower. With that in mind, immediate support seems to be the 61.8% Fibonacci retracement at 17482 before the midpoint kicks in at 17136. Further losses would then open the door to revisiting the current 2022-year low at 15671.

Nifty 50 Daily Chart
--- Written by Daniel Dubrovsky, Strategist for DailyFX.com
To contact Daniel, use the comments section below or @ddubrovskyFX on Twitter
Trade Smarter - Sign up for the DailyFX Newsletter
Receive timely and compelling market commentary from the DailyFX team


