


US Dollar, AUD/USD, NZD/USD, Technical Analysis, Retail Trader Positioning - Talking Points
- Retail traders growing increasingly bullish the US Dollar
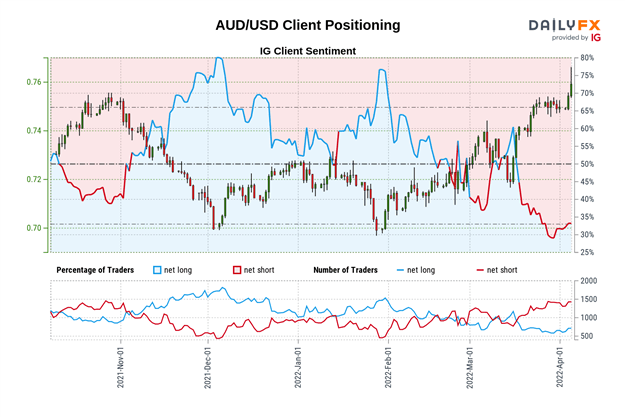
- AUD/USD, NZD/USD net-long bets are slowly on the rise
- Is this a bearish warning? What are key levels to watch?

The US Dollar has been weakening against sentiment-linked currencies, such as the Australian and New Zealand Dollars, as of late. However, looking at IG Client Sentiment (IGCS), which is a gauge of retail trader positioning, traders have recently started to increase their bullish bets on the Greenback. This is resulting in increasing AUD/USD and NZD/USD long bets. IGCS tends to function as a contrarian indicator. With that in mind, could we see a turning point for AUD and NZD next?
Australian Dollar Sentiment Outlook - Bearish
The IGCS gauge shows that about 33% of retail traders are net-long AUD/USD. Since most investors are biased to the downside, this hints that prices may continue rising. However, downside exposure has decreased by 8.30% and 7.71% compared to yesterday and last week, respectively. With that in mind, the combination of overall and recent changes in positioning are warning that prices may soon reverse lower.
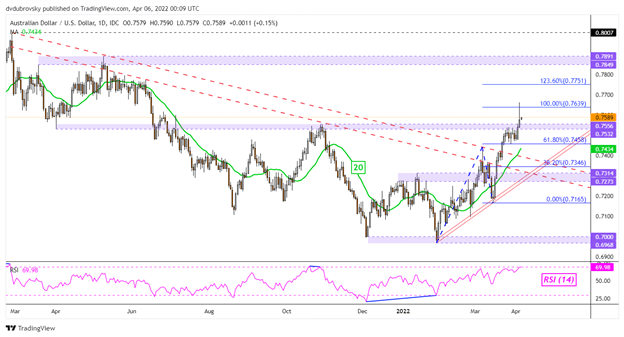
AUD/USD Daily Chart
AUD/USD recently closed above the 0.7532 – 0.7556 inflection zone, opening the door to extending gains since late January. Still, prices left behind a large upper wick on April 5th. This can be seen as a sign of indecision. Immediate resistance seems to be the 100% Fibonacci extension at 0.7639. A daily close above this price exposes the 123.6% level at 0.7751 before peaks from May 2021 come into focus. On the downside, keep a close eye on the 20-day Simple Moving Average (SMA) for support. Taking out the latter may open the door to testing rising support from January.

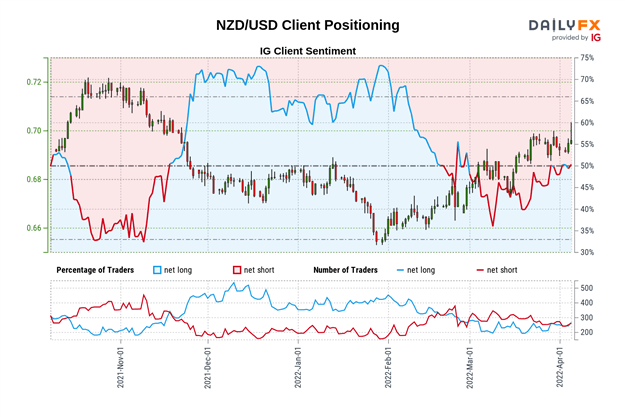
New Zealand Dollar Sentiment Outlook - Bearish
The IGCS gauge shows that about 54% of retail traders are net-long NZD/USD. Since most investors are now biased to the upside, this suggests that the pair may fall ahead. This is as downside exposure has decreased by 16.09% and 15.44% compared to yesterday and last week, respectively. With that in mind, the combination of overall and recent changes in positioning is offering a stronger bearish contrarian trading bias.
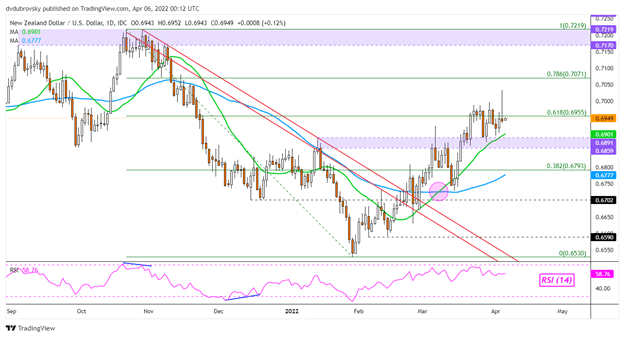
NZD/USD Daily Chart
The New Zealand Dollar also remains in an uptrend since late January. Unlike AUD/USD, NZD/USD has been struggling to find further upside momentum as of late. A large upper shadow was left behind on April 5th, hinting at indecision. Clearing the 61.8% Fibonacci retracement at 0.6955 exposes the 78.6% level at 0.7071 before peaks from October come into focus. Still, a bullish ‘Golden Cross’ remains in play between the 20- and 50-day SMAs, offering an upside bias. Breaking under the 20-day line could open the door to losses, placing the focus on the 0.6859 – 0.6891 inflection zone.
Introduction to Technical Analysis
Learn Technical Analysis
Recommended by Daniel Dubrovsky
*IG Client Sentiment Charts and Positioning Data Used from April 5th Report
--- Written by Daniel Dubrovsky, Strategist for DailyFX.com
To contact Daniel, use the comments section below or @ddubrovskyFX on Twitter


