


Dow Jones, S&P 500, Technical Analysis, Retail Trader Positioning - Talking Points
- Retail traders boost long bets on Wall Street amid Ukraine tensions
- As a contrarian signal, this may hint at Dow Jones, S&P 500 losses
- Check out this week’s webinar recording for fundamental overview

Amid geopolitical tensions in Ukraine, data from IG Client Sentiment (IGCS) shows that retail traders are increasingly betting that the Dow Jones and S&P 500 may rally ahead. Upside exposure has been on the rise. At times, IGCS can behave as a contrarian indicator. If this trend in positioning continues, then the road ahead for Wall Street could be tough. For a more comprehensive overview, check out the recording of my webinar above.
Dow Jones Sentiment Outlook - Bearish
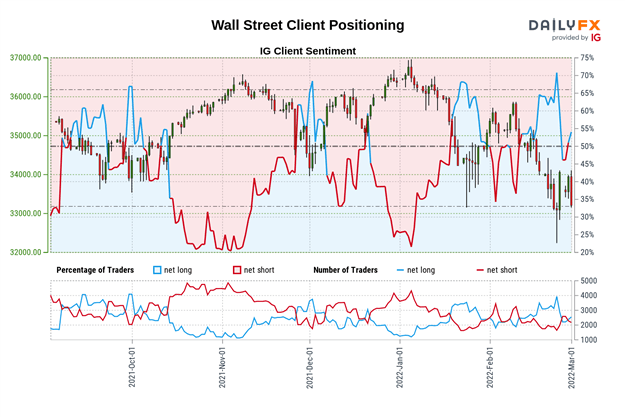
The IGCS gauge shows that about 63% of retail investors are net-long the Dow Jones. Upside exposure has increased by 11.25% and 6.36% compared to yesterday and last week respectively. Since most traders are biased to the upside, this hints that prices may continue falling. This, plus recent shifts in positioning, are offering a stronger bearish contrarian trading bias.
Dow Jones Futures Daily Chart
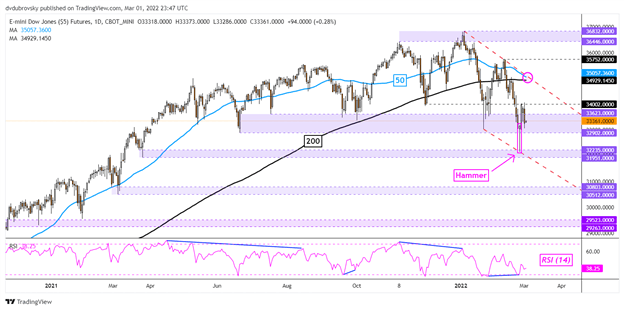
Dow Jones futures appear to be trading within the boundaries of a Falling Wedge chart formation, which could spell weakness in the near term if prices remain within the boundaries of it. The index is consolidating around the 32902 – 33623 support zone after a Hammer candlestick pattern. The latter spells indecision. Further gains could hint at a retest of the wedge’s ceiling, where a bearish Death Cross between the 50- and 200-day Simple Moving Averages seems likely to form. Further losses expose the 31951 – 30803 support zone before March 2021 lows come into focus.

S&P 500 Sentiment Outlook - Bearish
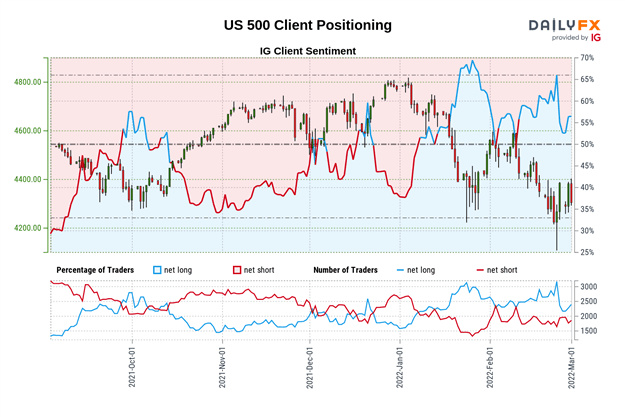
The IGCS gauge reveals that about 58% of retail traders are net-long the S&P 500. Upside exposure has increased by 4.01% compared to yesterday but is 2.79% lower versus a week ago. Since most investors are biased to the upside, this hints further weakness may be in store for the index. The combination of that and recent changes in positioning are offering a stronger bearish contrarian trading bias.
S&P 500 Futures Daily Chart
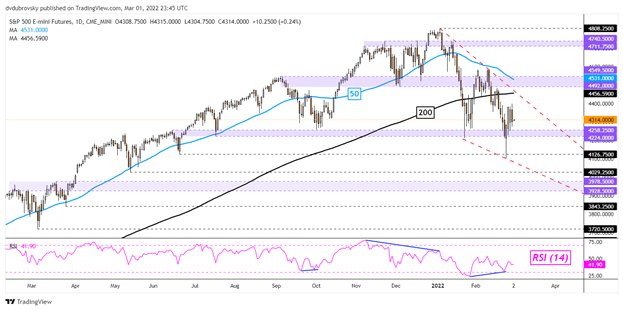
S&P 500 futures are also trading within the boundaries of a Falling Wedge chart formation. Key support held as the 4224 – 4258 inflection zone. Further gains would place the focus on the ceiling of the wedge, where a Death Cross between the 50- and 200-day SMAs may form on the horizon, offering key resistance. Further losses would place the focus on the June 21st low at 4126 before the May bottom at 4029 comes into focus. Positive RSI divergence may persist, showing that downside momentum is fading. That can at times precede a turn higher.
Introduction to Technical Analysis
Learn Technical Analysis
Recommended by Daniel Dubrovsky
*IG Client Sentiment Charts and Positioning Data Used from March 1st Report
--- Written by Daniel Dubrovsky, Strategist for DailyFX.com
To contact Daniel, use the comments section below or @ddubrovskyFX on Twitter


