


Gold, XAU/USD, Dow Jones, Technical Analysis, Retail Trader Positioning - Talking Points
- Retail traders increasing downside exposure in gold, Dow Jones
- As a contrarian signal, this could be a sign of a rosy path ahead
- XAU/USD and Dow Jones near-term uptrends remain intact

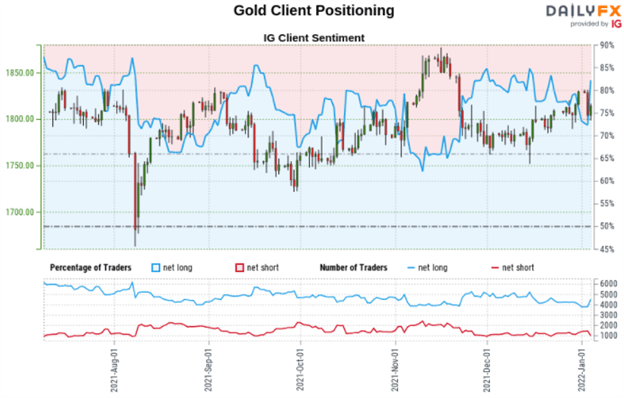
Taking a look at IG Client Sentiment (IGCS), retail traders have been increasingly betting that gold prices and the Dow Jones may fall ahead. In other words, net-long exposure in these assets is on the decline. IGCS can at times be a contrarian indicator. With that in mind, if this trend in positioning continues, gold and the Dow Jones could rise in the coming days.
Gold Sentiment Outlook - Bullish
The IGCS gauge shows that about 73% of retail traders are net-long gold. Since most traders are still biased to the upside, XAU/USD could fall. However, downside exposure has increased by 48.65% and 29.27% compared to a day and a week ago respectively. With that in mind, the combination of overall and recent changes in positioning offers a bullish-contrarian trading bias.
Technical Analysis
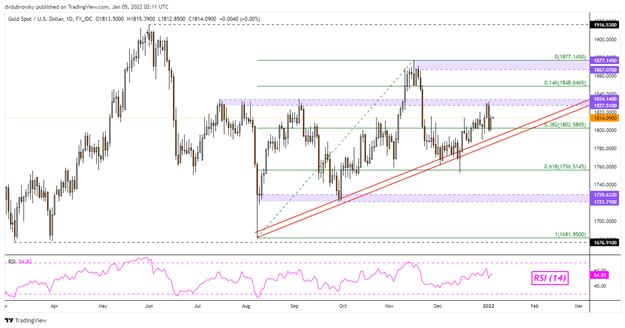
A rising range of support from August continues to offer an upside technical bias for gold. Broadly speaking, however, the yellow metal remains unchanged from price levels seen in July 2020. Immediate resistance appears to be the 1827 – 1834 inflection zone, which stands in the way from reaching the November high at 1877. Breaking under the trendline exposes the December low, which is closely aligned with the 61.8% Fibonacci retracement at 1756.

XAU/USD Daily Chart
Dow Jones Sentiment Outlook - Bullish
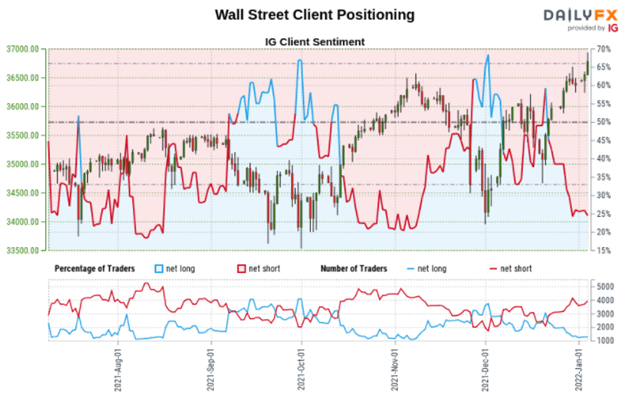
The IGCS gauge shows that roughly 22% of retail traders are net-long the Dow Jones. Since most traders are biased to the downside, this suggests prices may continue rising. This is as short positioning increased by 20.29% and 24.86% compared to yesterday and last week respectively. With that in mind, the combination of overall and recent shifts in positioning offers a bullish-contrarian trading bias.
Technical Analysis
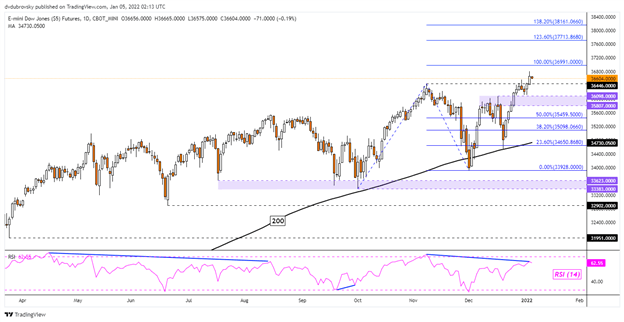
Dow Jones futures recently closed at an all-time high, taking out the November high at 36446. That has exposed the 100% Fibonacci extension at 36991, where the 123.6% and 138.2% levels at 37713 and 38161 respectively. This is as the 200-day Simple Moving Average (SMA) continues to offer a broader upside technical bias. That does leave the index vulnerable to a near-term pullback to the latter without necessarily overturning the broader uptrend.
Introduction to Technical Analysis
Learn Technical Analysis
Recommended by Daniel Dubrovsky
Dow Jones Daily Chart
*IG Client Sentiment Charts and Positioning Data Used from January 4th Report
--- Written by Daniel Dubrovsky, Strategist for DailyFX.com
To contact Daniel, use the comments section below or @ddubrovskyFX on Twitter


