


Euro, EUR/USD, EUR/JPY - Talking points
- EUR/USD settles into a low volatility arena to finish 2021
- EUR/JPYhas made a move higher after a Bollinger Band break-out
- The Euro has broken resistance against the Yen. Is this a new trend?

EUR/USD TECHNICAL OUTLOOK
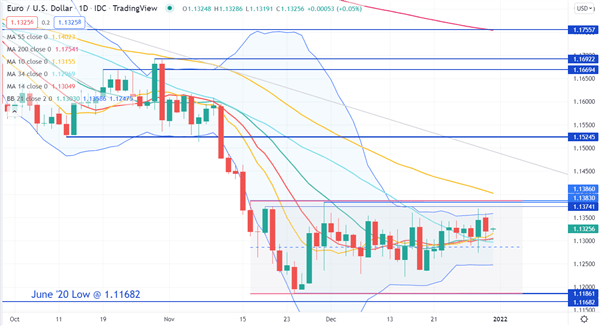
EUR/USD has been caught in a range between 1.11861 and 1.13860 since mid-November.
The recent low at 1.11861 is just above the June 2020 low of 1.11682. These two levels may provide support.
This sideways movement between 1.11861 and 1.13860 has seen volatility collapse, as shown by the narrowing of the 21-day simple moving average (SMA) based Bollinger Band. This might be indicating a range trading environment to start the new year.
Looking closely at the short term 10, 14, 21 and 34-day SMAs, they are sitting just below the price in a tight cluster between 1.12969 and 1.13155.
The 10, 14 and 21-day SMAs have also curved up, to have a positive gradient. This may indicate that bullish short-term momentum could be evolving.
It should be noted that the medium and long term SMAs, represented by the 55 and 200-day SMAs, remain above the price with a negative gradient. This might signal that medium and long-term bearish momentum remains.
When market ranges tighten, the Bollinger Band might be a signal to watch for a volatility breakout. The initial break outside the 2 standard deviation band is a possible indicator of an emerging trend.
Potential resistance could be at the previous highs and pivot points at 1.13741, 1.13830, 1.13860, 1.15245, 1.16694, 1.16922 and 1.17557.
Introduction to Technical Analysis
Moving Averages
Recommended by Daniel McCarthy
EUR/JPY TECHNICAL ANALYSIS
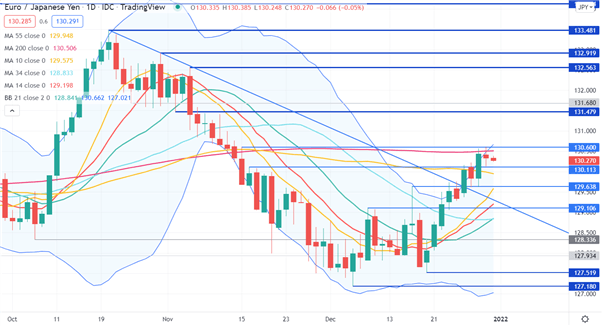
EUR/JPY has a different setup to EUR/USD, as Yen weakness as seen the cross rate move up through multiple resistance levels.
It has crossed above the 55 and 200-day SMAs but is yet to have a close above the 200-day SMA.
After closing outside the upper band of the 21-day based Bolling Band last week, EUR/JPY has continued higher.
The 10, 14, 21 and 34-day SMAs are below the price and have positive gradients, possibly indicating bullish short-term momentum is unfolding.
Support levels might be at previous lows and pivot points of 130.113, 129.638, 129.106, 127.519 and 127.180.
On the topside, previous highs and pivot points that may offer resistance lie at 130.600, 131.479, 132.563, 132.919 and 133.481.
--- Written by Daniel McCarthy, Strategist for DailyFX.com
To contact Daniel, use the comments section below or @DanMcCathyFX on Twitter


