


Japanese Yen, USD/JPY, AUD/JPY - Talking Points
- USD/JPY appears to be lacking directional momentum for now
- Bollinger Band indicators lit up on AUD/JPY last week as it moved up
- JPY crosses have retreated inside recent ranges. Will the Yen slip further?
Introduction to Technical Analysis
Learn Technical Analysis
Recommended by Daniel McCarthy
USD/JPY – Technical Analysis
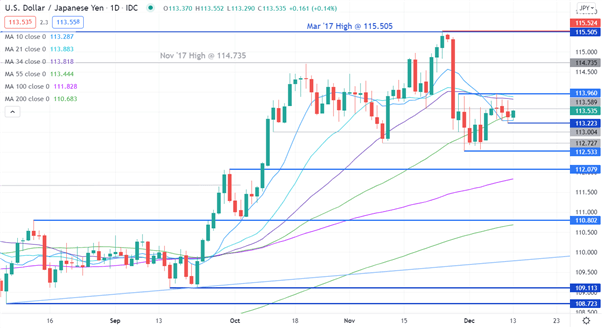
Consolidation continues for USD/JPY as it has remained in the 112.533 – 113.960 range for over 2 weeks. The 1-week range has been tighter, trading within 113.223 – 113.960.
As series of simple moving averages (SMA) are clustered near the current price, which might suggest that the market is lacking direction and could be moving sideways for now.
The short- and medium-term SMAs of 10-, 21-, 34- and 55-day duration lie between 113.28 and 113.96. These levels are also close to the recent low and high of 113.223 and 113.960. They may provide support and resistance respectively.
While these might lack directional momentum, the longer term 100- and 200-day SMAs remain below the price and both have positive gradients. This could suggest that there is underlying bullish momentum evolving.
Further up, the March 2017 peak of 115.505 and the recent high at 115.524 may offer resistance.
On the downside, support could be at the previous lows and pivot points of 112.533, 112.079, 110.802, 109.113 and 108.723.

AUD/JPY – Technical Analysis
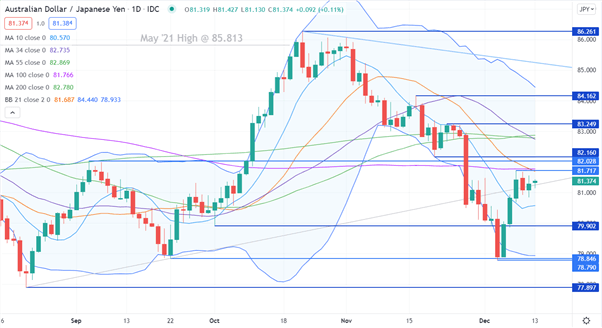
After making a 3-month low at 78.790, AUD/JPY spent last week rallying after it closed back inside the lower band of the 21-day SMA based Bollinger Band.
The low of 78.790 was just below the September low of 78.846 and these levels might now provide support.
The price has moved above the 10-day SMA which could suggest that short term bullish momentum may unfold.
The 21- and 100-day SMAs are currently at 81.688 and 81.766 which is either side of the high last week at 81.717. This area could offer near term resistance.
The 34-, 55- and 200-day SMAs are in a cluster between 82.736 and 82.87 and this area might offer resistance.
Further up, potential resistance may lie at the previous highs and pivots points of 82.028, 82.160, 83.249, 84.162 and 86.261.
Introduction to Technical Analysis
Moving Averages
Recommended by Daniel McCarthy
--- Written by Daniel McCarthy, Strategist for DailyFX.com
To contact Daniel, use the comments section below or @DanMcCathyFX on Twitter


