


Australian Dollar, AUD/USD, EUR/AUD - Talking Points
- AUD/USD has steadied after a weakening period as it consolidates
- EUR/AUD has moved back to the middle of a broad range after testing the high
- AUD has mixed momentum for now. Will a trend emerge in AUD/USD or EUR/AUD?
Introduction to Technical Analysis
Technical Analysis Tools
Recommended by Daniel McCarthy
AUD/USD TECHNICAL ANALYSIS
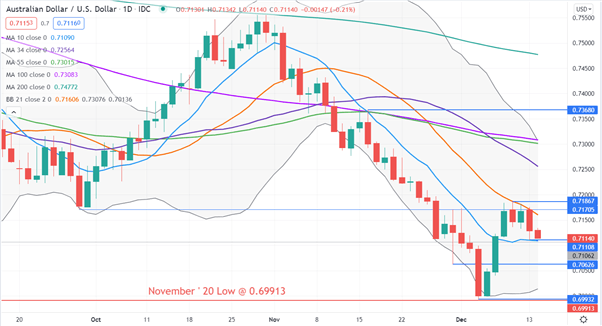
AUD/USD accelerated toward the November low of 0.69913, but the move was rejected. That tick down saw a close below the lower band of the 21-day simple moving average (SMA) based Bollinger Band. The next day saw a close above that lower band, which then saw a rally unfold.
From there, AUD/USD appears to have established a short-term range between the recent low and high of 0.71108 and 0.71867 respectively.
The low of 0.71108 also coincides with the 10-day SMA which could provide support.
Looking at the SMAs, a bearish triple moving average (TMA) formation requires the price to be below the short term SMA, the latter to be below the medium term SMA and the medium term SMA to be below the long term SMA. All SMAs also need to have a negative gradient.
All the SMAs have a negative gradient, including the 10-day SMA. However, the 10-day SMA is below the price. This might suggest a pause in bearishness. Should the price fall below the 10-day SMA, it could trigger bearish momentum to unfold.
Excluding the 10-day SMA, any 3 other SMAs would meet the criteria for a bearish TMA.
Below 0.71108, support may lie at the pivot point of 0.70626 or prior lows of 0.69932 and 0.69913.
Above 0.71867, resistance on the topside might be at the 34, 55 and 100-day SMAs or the previous high of 0.73680.

EUR/AUD TECHNICAL ANALYSIS
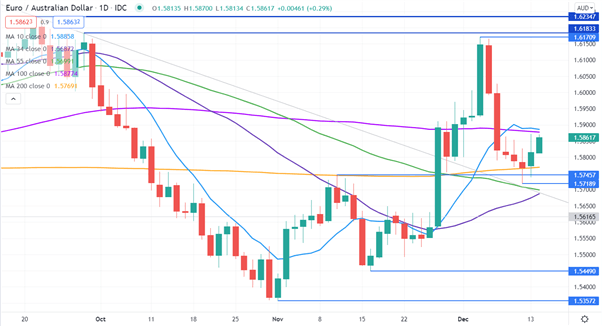
EUR/AUD appears to have conflicting momentum signals as it lies between several simple moving averages (SMA).
On the topside, the price has stopped short of 10 and 100-day SMAs and they might continue to offer resistance.
Further up, the recent high of 1.61709 and previous highs in September of 1.61833 and 1.62347, are also potential resistance levels.
The last few days has seen EUR/AUD piece below the 200-day SMA, but it is unable to have a close below it. The 34 and 55-day SMAs lie just below the recent low of 1.57189. These SMAs and the recent low could provide support. A pivot point at 1.57457 may also provide support.
--- Written by Daniel McCarthy, Strategist for DailyFX.com
To contact Daniel, use the comments section below or @DanMcCathyFX on Twitter


