


Japanese Yen, USD/JPY, AUD/JPY - Talking Points
- USD/JPY retreated dramatically from the precipice of a multi-year high
- Bollinger Band indicators could see AUD/JPY pause against momentum
- The Yen has rallied through a number of hurdles. How high can it jump?
Introduction to Technical Analysis
Moving Averages
Recommended by Daniel McCarthy
USD/JPY – Technical Analysis
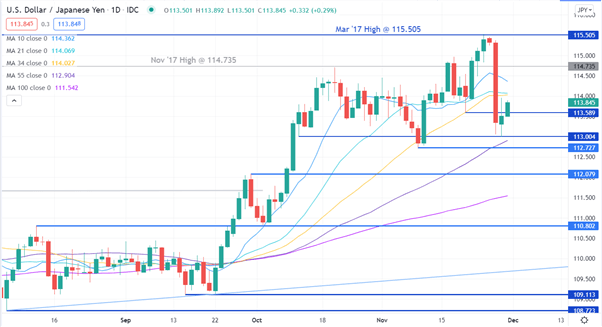
Last week USD/JPY stalled at the March 2017 high of 115.505 and then retraced 2 big figures to end the week.
The sharp move lower broke below several short-term simple moving averages (SMA) and a previous low at 113.589. This level and the 10, 21 and 34-day SMAs are now potential resistance levels.
The 55, 100, 200 and 260-day SMAs are below the price and have positive gradients. This could indicate bearish short-term momentum coming up against bullish medium and long-term momentum.
The sell off stopped just short of a pivot point level at 113.004 and it may provide support if tested again. Previous lows and other pivot points at 112.727, 112.079, 110.802, 109.113 and 108.723 are possible support levels.

AUD/JPY – Technical Analysis
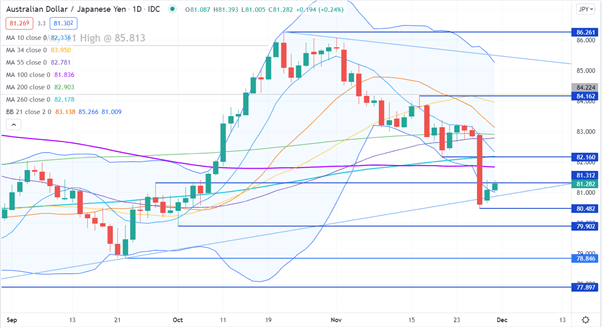
On Friday last week, AUD/JPY fell 2.7%. It broke down through two pivot points, the 100-day SMA pierced an ascending trend line to make a low of 80.482. It did recover the next day to be back above the trend line and a lack of follow through might indicate a false break.
The pivot pints at 81.312 and 82.16 may offer resistance, as well as the 100-day SMA currently at 81.836. 82.16 also coincides with the 260-day SMA. Further up, the previous highs at 83.249, 84.162 and 86.261 are possible resistance levels.
On that run down, it broke outside the lower band of 21-day SMA based Bollinger Band. A close back inside the lower band might indicate a pause in bearishness.
However, by moving below the 100-day SMA, AUD/JPY is now below all short, medium and long-term SMAs. It also has a negative gradient on all SMAs with the exception of the 200 and 260-day SMA. This could suggest that bearish mometum is evolving.
A cluster of SMAs lie between 82.160 and 83.139 and that zone might offer resistance.
On the downside, the previous lows at 80.482, 79.902, 78.846 and 77.897 are potential support levels.
--- Written by Daniel McCarthy, Strategist for DailyFX.com
To contact Daniel, use the comments section below or @DanMcCathyFX on Twitter


