


Japanese Yen, USD/JPY, EUR/JPY - Talking Points
- USD/JPY has gone into consolidation mode after making a new high last week
- Bollinger Bands and a candlestick are not enough for USD/JPY to go lower so far
- The Euro has lost ground to the Yen. Will EUR/JPY make a new 9-month low?

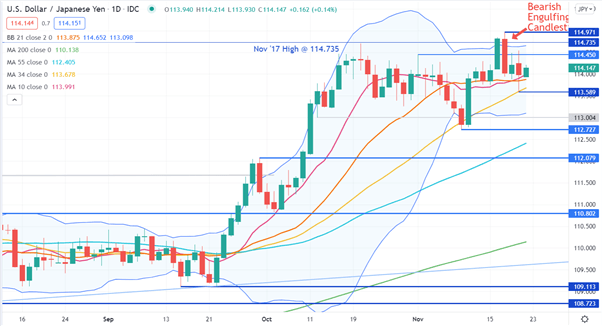
USD/JPY – Technical Analysis
Last week, USD/JPY made a new high when it took out the peak of November 2017. It has since consolidated and traded within the 112.727 – 114.971 range for over a month. These levels might now provide support and resistance respectively.
The Bearish Engulfing candlestick made on the day of the multi-year high has seen USD/JPY depreciate to 113.589, which coincided with the 34-day simple moving average (SMA). This may now be a support level.
There was another potential reversal signal from last week. The price closed above the upper band of the 21-day simple moving average (SMA) based Bollinger Band. The following day it closed back inside the band. This has seen some bearishness unfold but so far it has lacked follow through.
Conversely, a bullish triple moving average (TMA) formation remains intact, despite the recent weakness in price.
A TMA requires the price to be above the short term simple moving average (SMA), the latter to be above the medium term SMA and the medium term SMA to be above the long term SMA. All SMAs also need to have a positive gradient.
Looking at where the price is and the arrangement of the 10, 55 and 200-day SMAs, all of these conditions have been met. It should be noted though that past performance is not indicative of future results.
Besides the recent high of 114.971, resistance could be at the pivot points of 114.450 and 114.735.
On the downside, possible support may lie at the previous lows of 113.589 and 112.727, the pivot points at 112.079 and 110.802 or the lows from August and September of 109.113 and 108.723.

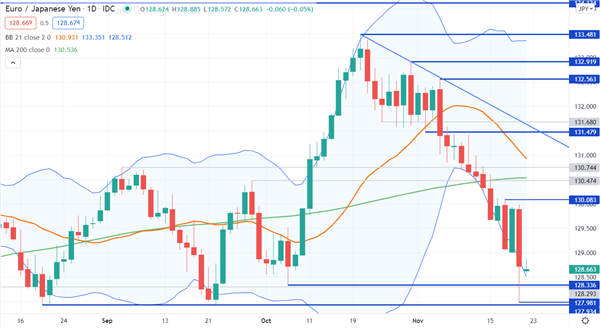
EUR/JPY – Technical Analysis
Going into the end of last week, EUR/JPY saw significant weakening that threatened the previous low 127.934. It made a low of 127.981 and these levels might provide support if tested.
On that run down, it broke outside the 21-day based Bollinger Band, even though the width of the bands expanded with increasing volatility. It moved outside and then inside the lower band three times which might indicate market uncertainty.
Resistance could be offered at the recent high of 130.083 or at the pivot point of 131.479. Should a sustainable rally get underway, resistance may also be found at the previous highs of 132.563, 132.919, 133.481 and the June peak of 134.124. There is also a descending trend line that currently intersects at 131.60.
--- Written by Daniel McCarthy, Strategist for DailyFX.com
To contact Daniel, use the comments section below or @DanMcCathyFX on Twitter


