


British Pound, GBP/USD - Talking Points
- GBP/USD bounced back after making a new low for the year
- The Pound has seen increased volatility as it looks to hold ground
- Will Sterling continue to be undermined and make fresh lows again?

GBP/USD TECHNICAL ANALYSIS
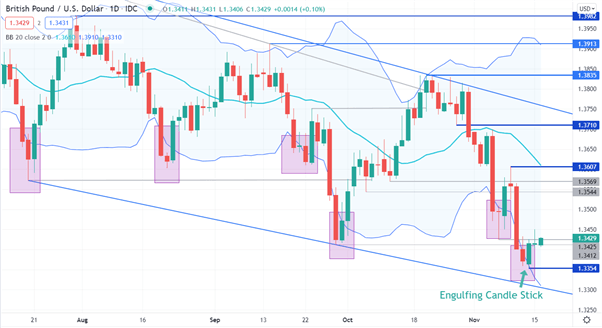
GBP/USD has recently moved lower toward a descending trend-line.
The price moved under the lower band of the 21-day simple moving average (SMA) based Bollinger Band for the second time in November.
Since July, this is the sixth time GBP/USD has done this. The observation here is the price closing outside the lower Bollinger Band. Once the price then closes back inside the Bolling Band, there might be some bullishness evolve.
When this observation occurred in July and August, GBP/USD appreciated in the following few weeks. However, the first time this event happened in September, GBP/USD depreciated and then traded outside of the lower band again. On the second occasion in September when the close went below and then back inside the band, GBP/USD appreciated.
In early November, the price closed outside the lower band and then closed inside the band before depreciating further. This happened for the second time in November at the end of last week.
The Bollinger Bands widened notably on the recent moves, illustrating increasing volatility.
The price action on Friday also developed a bullish Engulfing candlestick pattern. The pattern involves two candles with the second candle completely engulfing the ‘body’ of the previous red candle.This occurs when the open is below the close of the previous day and the close is above the open of the previous day. This was observed after the close on Friday.
A key component to looking at technical indicators is to ensure that robust Risk Management techniques are also employed. It should be noted though that past performance is not indicative of future results.
The recent low at 1.3354 and the descending trend line, currently dissecting at 1.3300, could provide support.
On the topside, the previous highs at 1.3607 and 1.3835 may offer resistance. In between those levels there is the 21-day SMA currently at 1.3618, a pivot point at 1.3710 and a descending trend line presently at 1.3760, that are potential resistance levels.
Introduction to Technical Analysis
Moving Averages
Recommended by Daniel McCarthy
--- Written by Daniel McCarthy, Strategist for DailyFX.com
To contact Daniel, use the comments section below or @DanMcCathyFX on Twitter


