


Japanese Yen, USD/JPY, EUR/JPY - Talking Points
- USD/JPY could be looking at a multi-year high as USD flexes
- EUR/JPY momentum signals might be gaining traction within broad range
- Japanese Yen has mixed fortunes against USD and EUR. Where to next?

USD/JPY – Technical Analysis
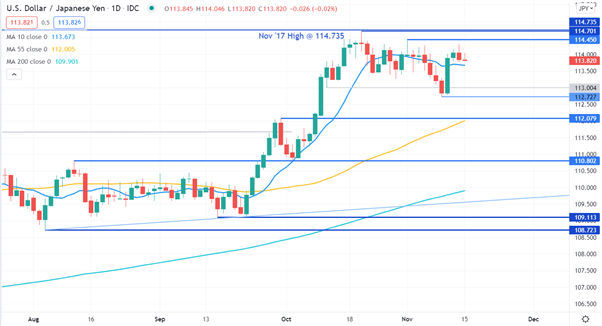
USD/JPY made a high in mid-October at 114.701 that was just shy of the November 2017 peak of 114.735. These 2 levels may offer resistance on a move higher. A recent high at 114.450 could offer resistance ahead of them.
Support might be at last weeks’ low of 112.727 and below that, there are 2 pivot points at 112.079 and 110.802 that are potential support. Further down, previous lows a 109.113 and 108.723 are potential support levels.
A bullish triple moving average (TMA) formation requires the price to be above the short term simple moving average (SMA), the latter to be above the medium term SMA and the medium term SMA to be above the long term SMA. All SMAs also need to have a positive gradient.
The market is above the 10, 55 and 200-day SMAs and the 55 and 200-day SMAs have a positive gradient. However, the 10-day SMA has a slightly negative slope. If the price remains above the 10-day SMA, then it will turn positive, and a bullish TMA formation could be observed.
It should be noted though that past performance is not indicative of future results.

EUR/JPY – Technical Analysis
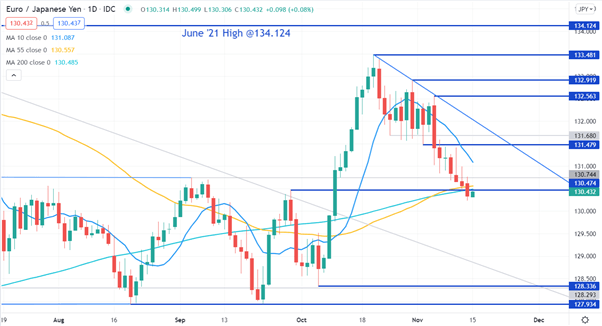
Overall, EUR/JPY remains in a wide range of 127.934 to 134.124. The pivot point at 130.474 initially provided support last week but then the price moved below it and remained there. It may now be a level of resistance.
That move also went under the 55 and 200-day SMAs which could suggest that possible medium to long-term bearish momentum might unfold. The price was already below the short-term 10-day SMA.
Resistance could be offered at a pivot point at 131.479 or the previous highs of 132.563, 132.919, 133.481 and the June peak of 134.124. There is also a descending trend line that currently intersects at 132.00, which is a possible resistance level.
A Double Bottom was made through September and October at 127.934 and this might provide a base. Just above that, there is a previous low at 128.336 that may provide support.
--- Written by Daniel McCarthy, Strategist for DailyFX.com
To contact Daniel, use the comments section below or @DanMcCathyFX on Twitter


