


Euro Technical Analysis - EUR/USD, EUR/JPY. Levels to Watch
The Euro has established some range environments against the US Dollar and the Japanese Yen. Will the single currency break-out to establish a trend?
Euro, EUR/USD, EUR/JPY - Talking points
- EUR/USD and EUR/JPY have a different setup, but both are in a range
- There are mixed messages within EUR/JPY as the price battles for direction
- EUR/USD has rallied off the bottom,but is it enough to fight off momentum?

EUR/USD TECHNICAL OUTLOOK
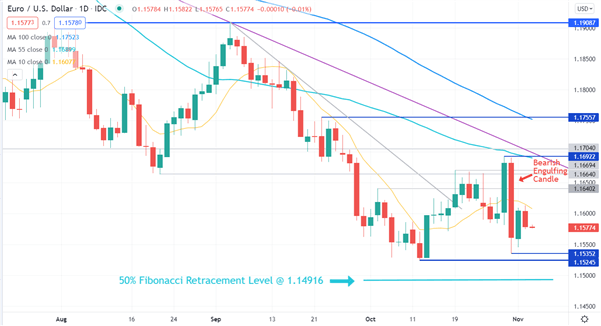
Last month, EUR/USD made a new low for the year at 1.15245. It then rallied and stalled bearish momentum by breaking above the 10-day simple moving average (SMA) and then the 34-day SMA. It has since moved back below these SMAs which might suggest bearish momentum may resume.
Going into the end of last week, EUR/USD saw 2 days of increased volatility. It moved above a pivot point and a previous high to trade at 1.16922.
However, it was unable to overcome the 55-day SMA and abruptly moved back down. That move created a Bearish Engulfing candle on the way to make a low at 1.15352, near the low of the year at 1.15245.
Since making that low, the price has remained below all short, medium and long term SMAs. A bearish triple moving average (TMA) formation requires the price to be below the short term SMA, the latter to be below the medium term SMA and the medium term SMA to be below the long term SMA. All SMAs also need to have a negative gradient.
EUR/USD is below the 10-day SMA, which is below the 55-day SMA, which is below the 100-day SMA. All SMAs have a negative gradient. This might suggest bearish momentum could evolve.
Possible resistance may be at the previous highs of 1.16922, 1.17557 and a Double Top at 1.19087.
On the downside, the previous lows at 1.15352 and 1.15245 are possible support levels.
Beyond that is the 50% Fibonacci retracement level of the move from 1.06337 to 1.23495 at 1.14916.
EUR/JPY TECHNICAL ANALYSIS
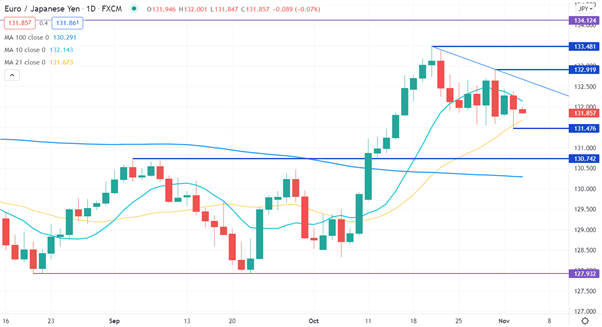
EUR/JPY appears to be consolidating again after breaking out of a range last month. The SMAs are providing mixed messages although the price recently bounced off the 10-day SMA.
On the topside, the previous recent highs of 132.919, 133.481 and the 3-year high of 134.124 may offer resistance.
Below the market, support could be found at the recent low of 131.476 that is near the 10-day SMA. Support might also be provided at the pivot point of 130.742 or the low of 127.932.
Introduction to Technical Analysis
Learn Technical Analysis
Recommended by Daniel McCarthy
--- Written by Daniel McCarthy, Strategist for DailyFX.com
To contact Daniel, use the comments section below or @DanMcCathyFX on Twitter


