BRITISH POUND, US DOLLAR, JAPANESE YEN, GBP/USD, GBP/JPY – TALKING POINTS:
- British Pound down with 2yr Gilt yields despite strong UK Q2 GDP data
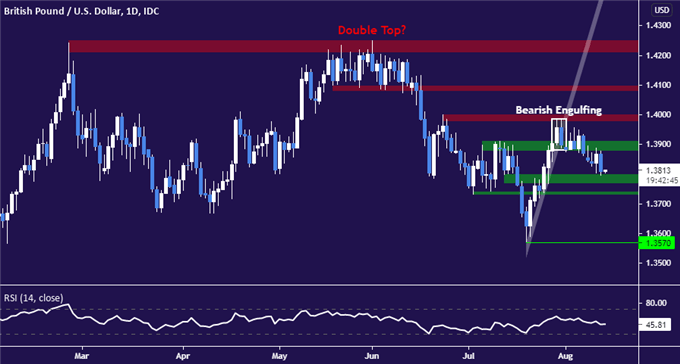
- GBP/USD may be resuming downtrend after counter-trend support break
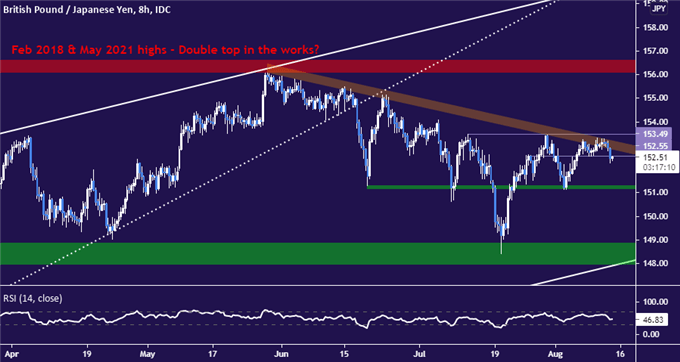
- GBP/JPY taking aim below 152.00 figure after range support is breached


The British Pound tracked broadly lower against its major counterparts in the wake of robust second-quarter GDP figures. Output grew 22.2 percent in the three months to June 2021 compared with the same period in 2020, marking the fastest on-year growth rate in nearly seven decades.
Nevertheless, Sterling fell after a bit of digestion following the release. Prices tracked lower alongside front-end UK government bond yields, implying that traders did not envision the growth surge as likely to influence a hawkish pivot in Bank of England monetary policy.
That probably speaks to the central bank’s somewhat dismissive rhetoric about the recent inflationary upswing – which it has pinned on temporary factors – as well as a limited scope for growth to keep pace with the Q2 surge. The boost from initial reopening following Covid-inspired lockdowns may be mostly exhausted.
GBP/USD, GBP/JPY TECHNICAL ANALYSIS
From here, GBP/USD seem so have re-engaged the downtrend extending from June highs with a break of upward-sloping support guiding the late-July upswing. Sellers are now testing a support block in the 1.3729-98 zone, with a daily close below its lower bound setting the stage for a foray below the 1.3600 figure.
Immediate resistance is in the 1.3879-1.3910 area. A rebound that brings prices back above that barrier and confirms the breach on a daily closing basis may beckon another challenge of the 1.4000 handle. Securing a foothold above that appears to be a prerequisite for neutralizing selling pressure in earnest.

GBP/USD daily chart created with TradingView
Meanwhile, GBP/JPY looks to have recoiled from downward-sloping trend resistance guiding prices lower since late May. Slipping below range support at 152.55 appears to have opened the way for the pair to retest support in the 151.15-29 inflection zone.
Immediate resistance lines up at 153.49, a barrier that has capped upside progress since mid-July. A break above that confirmed with daily close may sap sellers’ confidence and allow for a rise into 156.08-61 region, a would-be Double Top marked by swing highs in February 2018 and May of this year.

GBP/JPY 8-hour chart created with TradingView
BRITISH POUND TRADING RESOURCES
- Just getting started in the markets? See our free trading guides
- What is your trading personality? Take our quiz to find out
- Join a free webinar and have your trading questions answered
--- Written by Ilya Spivak, Head Strategist, APAC at DailyFX.com
To contact Ilya, use the comments section below or @IlyaSpivak on Twitter


