


US Dollar, USD/CAD, AUD/USD, EUR/USD, Technical Analysis, Retail Trader Positioning - Talking Points
- Retail traders are increasingly betting the US Dollar may weaken
- Upside bets falling in USD/CAD, rising in AUD/USD & EUR/USD
- Check out recording to my webinar for detailed IGCS analysis

According to IG Client Sentiment (IGCS), retail traders appear to be increasingly betting that the US Dollar could depreciate ahead. Downside exposure in USD/CAD is on the rise, while upside bets are increasing in AUD/USD and EUR/USD.
IGCS can at times be a contrarian indicator. Meaning that, if this trend in positioning continues, the Greenback could continue seeing gains ahead. To learn more about using this tool, check out the recording to this week’s session on IGCS in the video above.
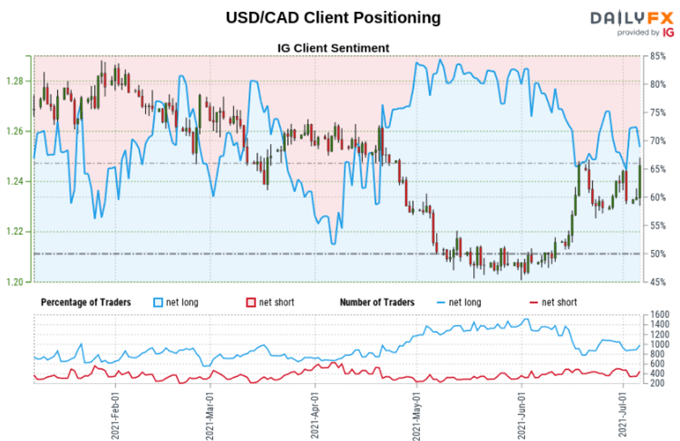
USD/CAD Sentiment Outlook - Bullish
The IGCS gauge implies that roughly 57% of retail traders are net-long USD/CAD. Upside exposure has decreased by 23.09% and 29.49% respectively over a daily and weekly basis respectively. The fact that traders are net-long hints prices may fall. But, recent changes in sentiment do warn that recent gains in the pair could continue ahead.

Technical Analysis
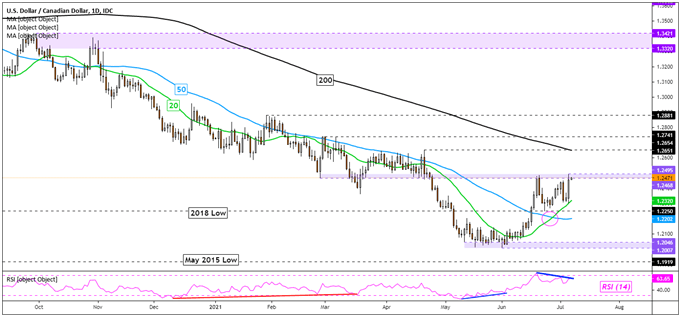
USD/CAD is facing the key 1.2469 – 1.2495 inflection zone as it faces its next hurdle in trying to extend June’s bottom. A bullish crossover between the 20-day and 50-day Simple Moving Averages (SMAs) could hint at further gains. But, negative RSI divergence shows that upside momentum is fading. That can at times precede a turn lower. Keep a close eye on the 200-day SMA, it may act as key resistance in the event of further gains.
USD/CAD Daily Chart
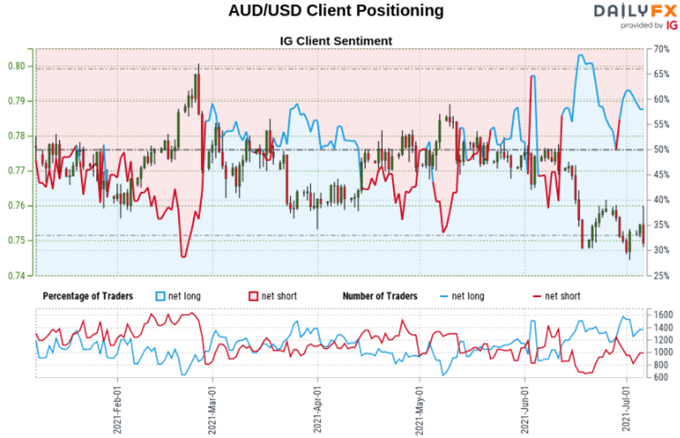
AUD/USD Sentiment Outlook - Bearish
The IGCS gauge implies that about 59% of retail traders are net-long AUD/USD. Downside exposure has decreased by 13.56% and 22.82% over a daily and weekly basis respectively. The fact that traders are net-long suggests that prices may continue falling. The combination of this and recent shifts in sentiment are offering a stronger bearish contrarian trading bias.
Technical Analysis
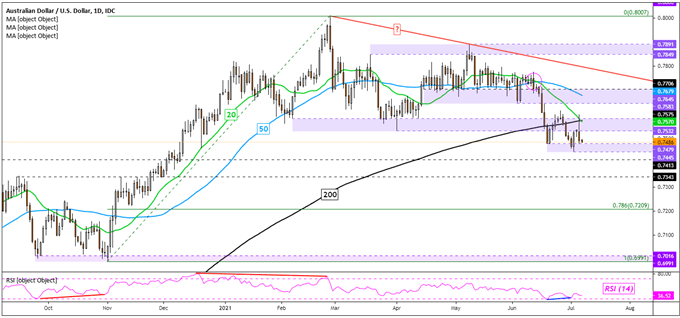
AUD/USD attempted to break above the key 0.7532 – 0.7583, but prices came back down and left behind a fairly large upper shadow. Immediate support appears to be the 0.7445 – 0.7479 range, with a bearish crossover between the 20-day and 50-day SMAs offering a near-term downward technical bias. The pair is also attempting to confirm a drop through the 200-day SMA, warning of a meaningful shift in the Aussie’s trend.

AUD/USD Daily Chart
EUR/USD Sentiment Outlook - Bearish
The IGCS gauge implies that about 60% of retail traders are net-long EUR/USD. Upside exposure increased by 0.54% and 26.07% over a daily and weekly basis respectively. The fact traders are net-long hints prices may continue falling. In addition, recent shifts in positioning are offering a stronger bearish contrarian trading bias.

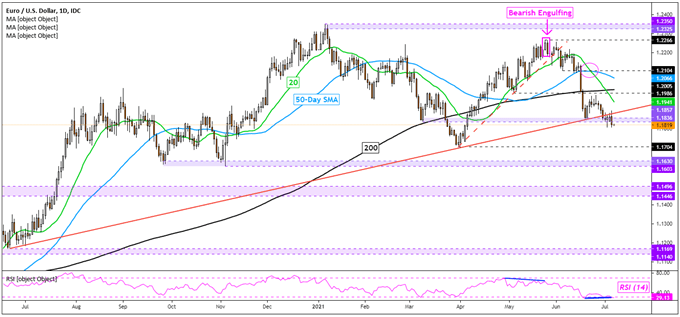
Technical Analysis
EUR/USD is attempting to confirm a close under rising support from June 2020, as well as the key 1.1857 – 1.1836 inflection zone. This has exposed the March low at 1.1704. Positive RSI divergence does show that downside momentum is fading, which can at times precede a turn higher. But, the 20-, 50- and 200-day SMAs seem to be offering a dominant downward technical bias for the pair.

EUR/USD Daily Chart
*IG Client Sentiment Charts and Positioning Data Used from July 7th Report
--- Written by Daniel Dubrovsky, Strategist for DailyFX.com
To contact Daniel, use the comments section below or @ddubrovskyFX on Twitter


