


Japanese Yen, USD/JPY, GBP/JPY, Technical Analysis, Retail Trader Positioning - Talking Points
- Retail traders are betting the Yen could resume this year’s drop
- Upside exposure is slowly climbing in USD/JPY and GBP/JPY
- USD/JPY eyeing key trendline, GBP/JPY to moving averages

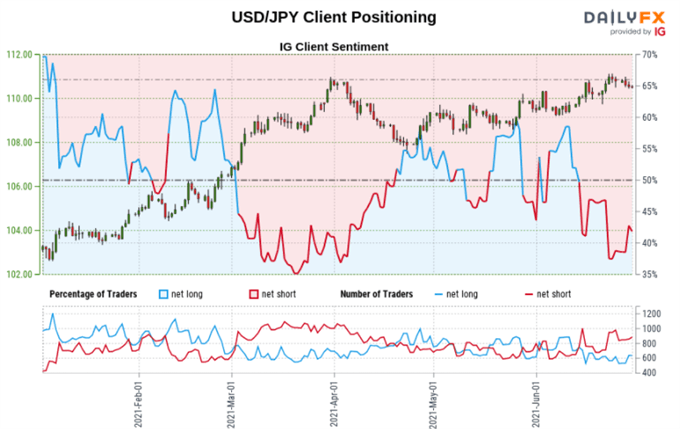
According to IG Client Sentiment (IGCS), retail traders have been increasing their upside exposure in Japanese Yen pairs such as USD/JPY and GBP/JPY. IGCS is usually a contrarian indicator, meaning that if investors continue building up long bets, then this could be a signal that these pairs may be vulnerable ahead. To learn more about how you can use this tool in your own trading strategy, check out the latest webinar recording of my session about IGCS.
USD/JPY Sentiment Outlook - Bearish
The IGCS gauge implies that roughly 42% of retail traders are net-long USD/JPY. Upside exposure has increased by 5.65% and 10.83% over a daily and weekly basis respectively. The fact that investors are still overwhelmingly net-short the pair hints prices may continue rising. However, recent changes in sentiment warn that the current trend may soon reverse lower.

Technical Analysis
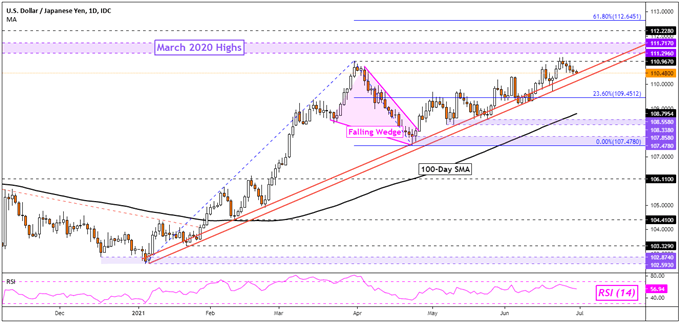
USD/JPY continues to trade with a broadly upside bias, guided higher by rising support from the beginning of this year. The pair is fast approaching highs from March 2020, making for a key zone of resistance between 111.29 and 111.71. However, getting to this zone entails pushing above the March 2021 high at 110.96. A breakout under the trendline could be a warning sign that the dominant upside bias may be at risk. That would also expose the 100-day Simple Moving Average (SMA) below.
USD/JPY Daily Chart
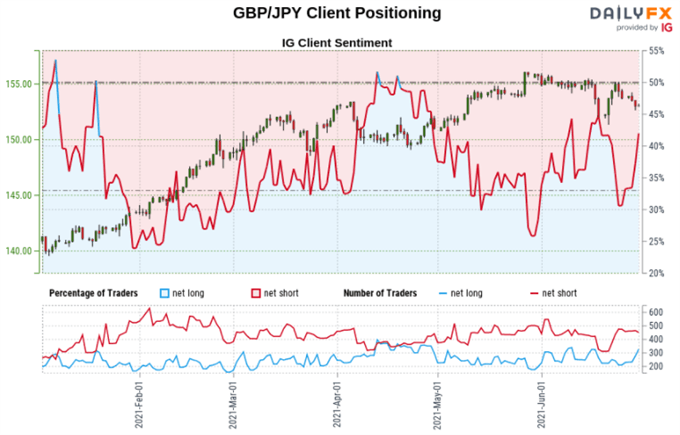
GBP/JPY Sentiment Outlook - Bearish
The IGCS gauge implies that about 43% of retail traders are net-long GBP/JPY. Upside exposure increased by 19.64% and 41.95% over a daily and weekly basis respectively. Still, since the majority of traders are net-short suggests that prices may continue rising. However, recent changes in sentiment do warn that GBP/JPY could reverse lower.
Technical Analysis
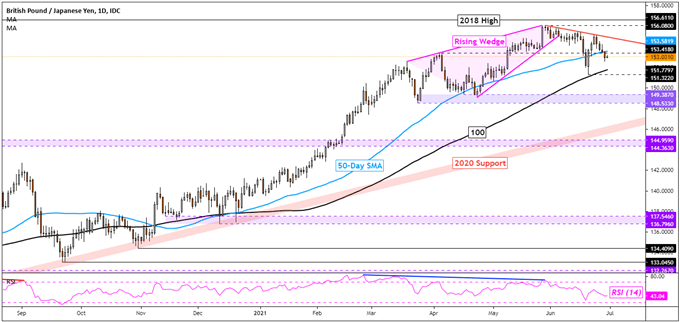
GBP/JPY continues to trade lower in the aftermath of breaking under a bearish Rising Wedge chart pattern. The 50-day SMA could risk giving way, opening the door to facing the 100-day equivalent. Even in the event of a breakout under the latter, rising support from last year could still reinstate the dominant upside focus – see chart below. Guiding the pair lower in the near-term appears to be a falling trendline from the beginning of June. Key support below seems to be the 148.53 – 149.38 range in the event of deeper losses.
GBP/JPY Daily Chart
*IG Client Sentiment Charts and Positioning Data Used from June 30th Report
--- Written by Daniel Dubrovsky, Strategist for DailyFX.com
To contact Daniel, use the comments section below or @ddubrovskyFX on Twitter


