


US Dollar, USD/CAD, AUD/USD, EUR/USD, GBP/USD – Weekly Technical Outlook
- DXY Dollar index saw best weekly performance in over 14 months
- USD/CAD key downtrend ending? AUD/USD takes out 200 SMA
- EUR/USD eyeing key trendline, GBP/USD broke its equivalent

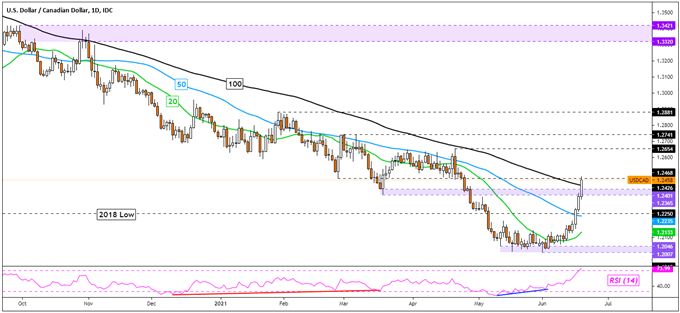
USD/CAD – Bullish
USD/CAD experienced its best week in about 15 months in the aftermath of the Fed rate decision. The dominant downtrend since 2020 could now be at risk as the pair is attempting to clear the 100-day Simple Moving Average (SMA). The 1.2468 inflection point is also in focus. If the US Dollar clears the latter against the Canadian Dollar, it could open the door to testing peaks from April. Otherwise, a turn back lower may place the focus on the 20-day and 50-day SMAs. These could establish a bullish crossover in the coming week.
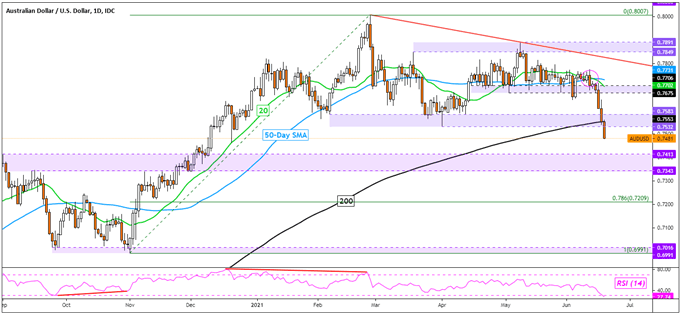
AUD/USD – Bearish
AUD/USD weakened the most in about 9 months this past week. This left the Australian Dollar breaking under the key 0.7532 – 0.7583 support zone after taking out the 0.7675 – 0.7706 range. The 200-day SMA was also broken, opening the door to a material downward shift. This has exposed the 0.7343 – 0.7413 inflection zone. Prices may pause gains around this range, but a bearish crossover between the 20-day and 50-day SMAs is bolstering the near-term downward bias. Further losses exposes 0.7209, the 78.6% Fibonacci retracement.

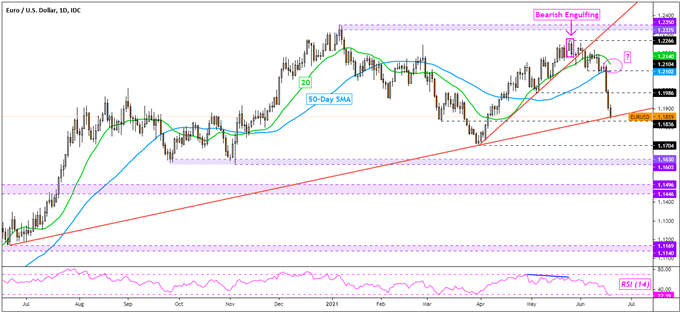
EUR/USD – Bearish
EUR/USD declined the most in over 14 months this past week, extending May’s top after a Bearish Engulfing candlestick pattern formed. Now, the Euro is testing a rising trendline from a year ago. A bearish crossover may also emerge if the 20-day SMA falls under the 50-day equivalent, further emphasizing the focus to the downside. Clearing 1.1836, which is the March 9th low, would expose 1.1704 thereafter. Otherwise, a bounce would likely place the focus back on the SMAs again.

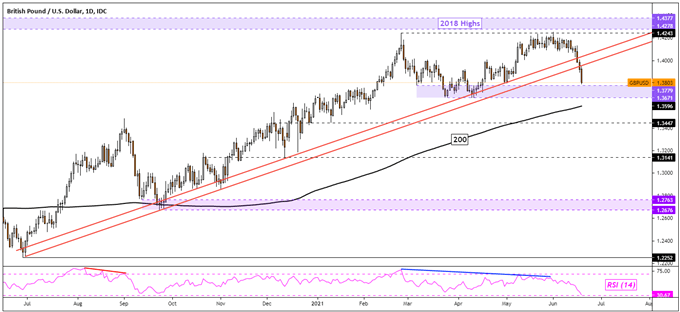
GBP/USD – Bearish
GBP/USD experienced the worst week in about 9 months, extending June’s top. The pair also cleared rising support from about a year ago. As such, the dominant uptrend is looking increasingly vulnerable. Extending losses may place the focus on the 1.3671 – 1.3779 support zone. At that point, the 200-day SMA could also come into play to reinstate the narrative to the upside. If prices bounce instead, the British Pound may turn back towards 2018 highs to retest former rising support.

--- Written by Daniel Dubrovsky, Strategist for DailyFX.com
To contact Daniel, use the comments section below or @ddubrovskyFX on Twitter


