


Dow Jones, S&P 500, Technical Analysis, Retail Trader Positioning - Talking Points
- Equities on Wall Street have been seeing selling pressure, will losses extend?
- Retail trader long bets in the Dow Jones and S&P 500 hint prices are at risk
- The indices confirmed bearish candlestick patterns, leaving them vulnerable

In this week’s session on IG Client Sentiment (IGCS), which is a tool to gauge retail trader positioning, I discussed the outlook for the Dow Jones and S&P 500. IGCS is usually a contrarian indicator. For detailed analysis, check out the recording of the session above, where I discussed how to use IGCS in a trading strategy. I also covered the fundamental outlook for US benchmark stock indexes.
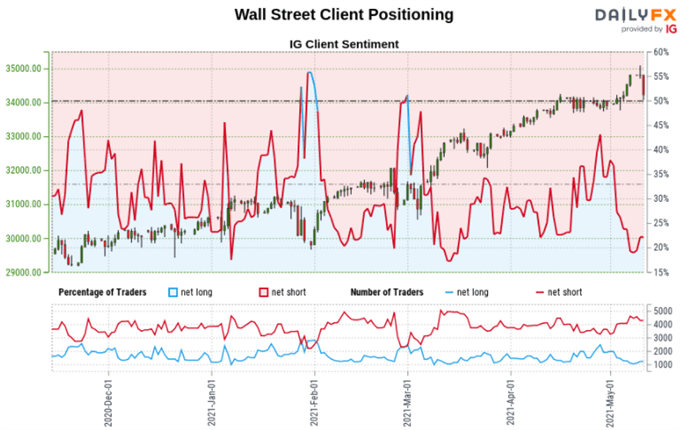
Dow Jones Sentiment Outlook - Bearish
The IGCS gauge implies that about 43% of retail traders are net-long the Dow Jones. The fact that traders are net-short hints the Dow may continue to rise. However, upside exposure has increased by 65.55% and 25.66% over a daily and weekly basis respectively. The recent changes in sentiment warn that the current price trend may soon reverse lower despite the fact traders remain net-short.

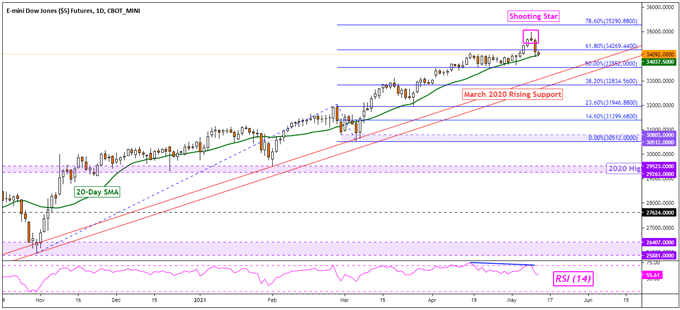
Technical Analysis
The Dow Jones confirmed a close under a Shooting Star candlestick pattern, hinting that further losses could be in store ahead. A break under the 20-day Simple Moving Average (SMA) would expose rising support from March 2020. This may reinstate the dominant upside focus. Resuming the uptrend could eventually open the door to testing the 78.6% Fibonacci extension at 35290.
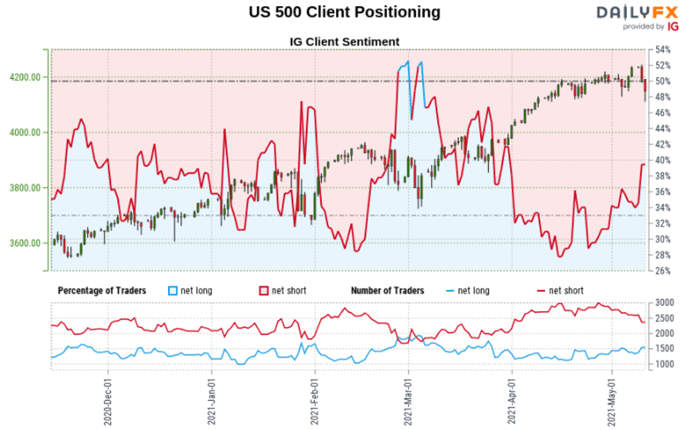
S&P 500 Sentiment Outlook - Bearish
The IGCS gauge implies that about 44% of retail traders are net-long the S&P 500. The fact traders are net-short hints that prices may keep rising. However, upside exposure has increased by 18.36% and 6.71% compared to yesterday and last week respectively. The recent changes in sentiment warn that the current price trend may soon reverse lower despite the fact traders remain net-short.
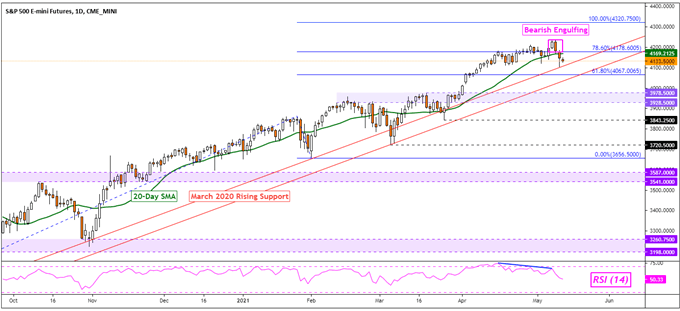
S&P 500 Futures Daily Chart
Technical Analysis
The S&P 500 has left behind a Bearish Engulfing candlestick pattern, subsequently confirming a close under it. That has opened the door to extending recent losses given that prices have also taken out the 20-day SMA. This is placing the focus on rising support from March 2020, which could reinstate the dominant focus to the upside. Resuming the uptrend places the focus on the 100% Fibonacci extension level at 4320.
S&P 500 Futures Daily Chart
*IG Client Sentiment Charts and Positioning Data Used from May 11th Report
--- Written by Daniel Dubrovsky, Strategist for DailyFX.com
To contact Daniel, use the comments section below or @ddubrovskyFX on Twitter


