


Bitcoin (BTC/USD), Litecoin (LTC/USD), Ethereum (ETH/USD), Technical Analysis – Talking Points
- Bitcoin is attempting to reverse a drop that cut 20% off its value
- Litecoin trying to follow suit, key trendline maintains upside focus
- Ethereum pushes into record highs, but momentum appears fading

Bitcoin Technical Outlook
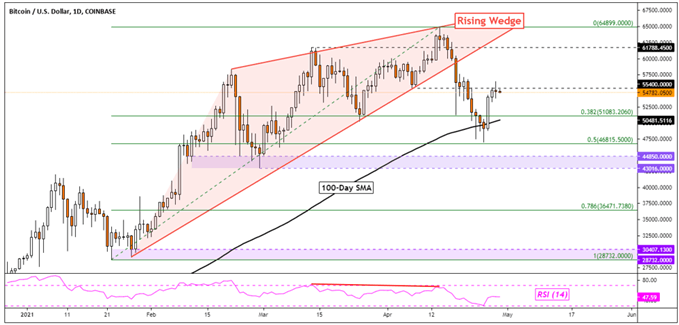
Bitcoin is attempting to recover the top that started in April which trimmed over 20% off its value. The dip followed bearish implications from a brewing Rising Wedge chart pattern, which still remains in play. Recent gains followed a bounced from the 100-day Simple Moving Average and the midpoint of the Fibonacci retracement at 46815.50.
Now, BTC/USD is facing its next test to see whether or not it could set a course to revisit the all-time high set earlier this month. The obstacle would be the 55400 inflection point, where taking it out exposes the March high at 61788, which could act as another inflection level. Otherwise, a turn lower from here would place the focus back on the April 25th low. Under that is the 43016 – 44850 support zone.
BTC/USD - Daily Chart
Litecoin Technical Outlook
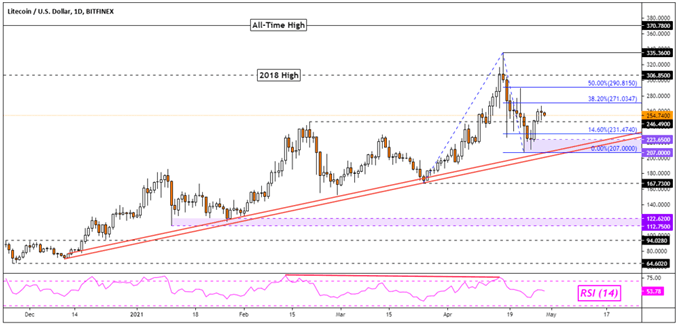
Litecoin is also attempting to reverse a sharp drop experienced earlier this month which shaved off over 20% of its value. LTC/USD bounced just above a rising trendline from December, leaving behind a key zone of support between 207 and 223. Immediate resistance seems to be at 271, which is the 38.2% Fibonacci extension. Near-term support appears to be at 246, the February high.
In the event of a turn lower, rising support from December may reinstate the dominant focus to the upside. Otherwise, taking it out would subsequently expose the March low at 167. Resuming the recent bounce may eventually pave the way to retest the 2018 peak at 306, with the April 17th high sitting above at 335. Taking out the latter would then expose the all-time high at 370.

LTC/USD - Daily Chart
Ethereum Technical Outlook
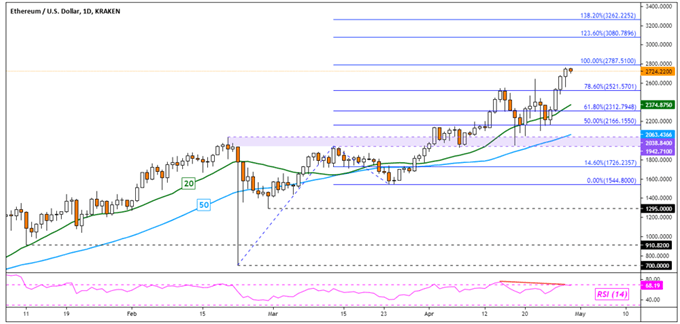
Ethereum continues to push deeper into record highs, with the 20-day and 50-day Simple Moving Averages maintaining the dominant upside focus. ETH/USD is now facing the 100% Fibonacci extension at 2787. But, negative RSI divergence does show that upside momentum is fading. This can at times precede a turn lower, where the moving averages could come into play again.
Immediate support appears to be the 78.6% level at 2521, with the 61.8% point sitting under that at 2312. Should the cryptocurrency extend losses beyond that, the 2038 – 1942 inflection zone could be a key point of interest. Otherwise, taking out the 100% level exposes the 123.6% point at 3080.
ETH/USD - Daily Chart
--- Written by Daniel Dubrovsky, Strategist for DailyFX.com
To contact Daniel, use the comments section below or @ddubrovskyFX on Twitter


