


New Zealand Dollar Forecast – Talking Points
- NZD/USD ranges between psychological level and key moving averages
- NZD/CAD pings resistance at the 100-day Simple Moving Average
- NZD/JPY may follow its recent pattern and move to set a higher high

NZD/USD Technical Breakdown
The New Zealand Dollar has made commendable progress versus the US Dollar this month, up nearly 3%, following a 3.44% drop in March. A large portion of NZD/USD’s April gains has followed a Falling Wedge breakout from earlier this month. Despite the progress, the currency pair is struggling to clear the 0.7200 psychological level this week.
A bearish cross between the 50-day and 100-day Simple Moving Averages may see a buildup in bearish sentiment. A break above the aforementioned 0.72 handle in the near term may negate the bearish signal, however. The more time price ranges below the level will likely bode poorly for the pair. Still, those same moving averages, which sit just below current prices, may step in to provide support.
NZD/USD Daily Chart
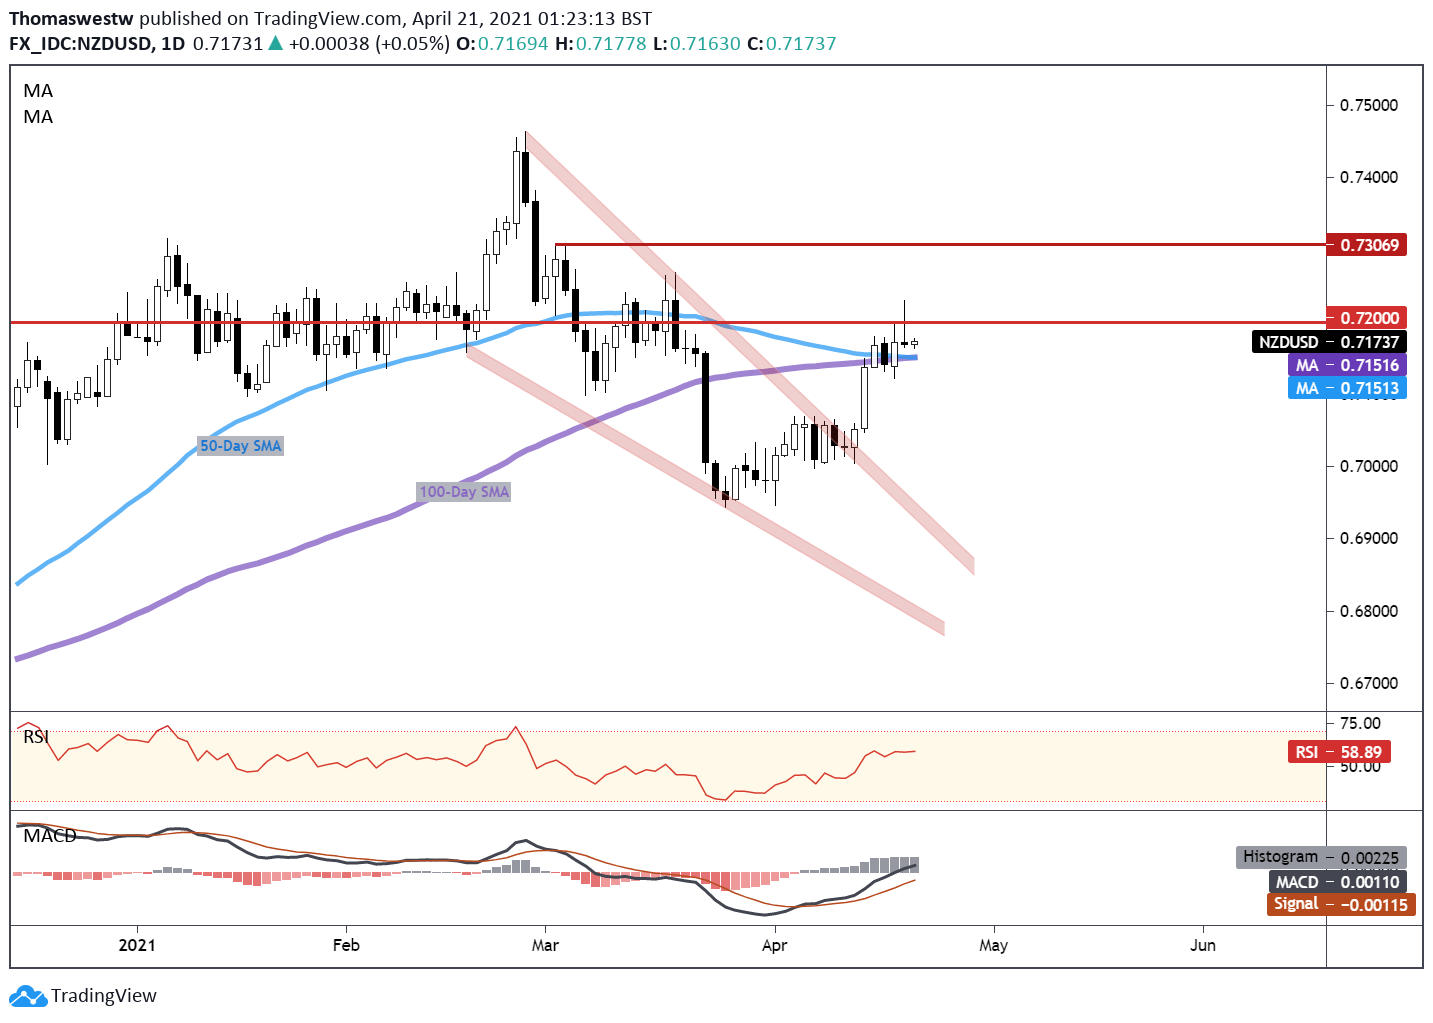
Chart created with TradingView
NZD/CAD Technical Breakdown
The Kiwi Dollar has made strides against the Canadian Dollar lately, up over 3% on the month. NZD/CAD strength has intensified into the latter half of the month, following a trendline breakout that stemmed from a Double Bottom pattern, an interesting technical development mentioned earlier this month.
The most imminent resistance point for the currency pair appears to be the 100-day SMA, which successfully turned back prices earlier this week. A downside move would see the 50-day SMA step in to offer a likely area of resistance. The upside path appears to be the path of least resistance, however, with MACD and RSI oriented higher. Furthermore, MACD crossed above its center line this week, a bullish signal.
NZD/CAD Daily Chart
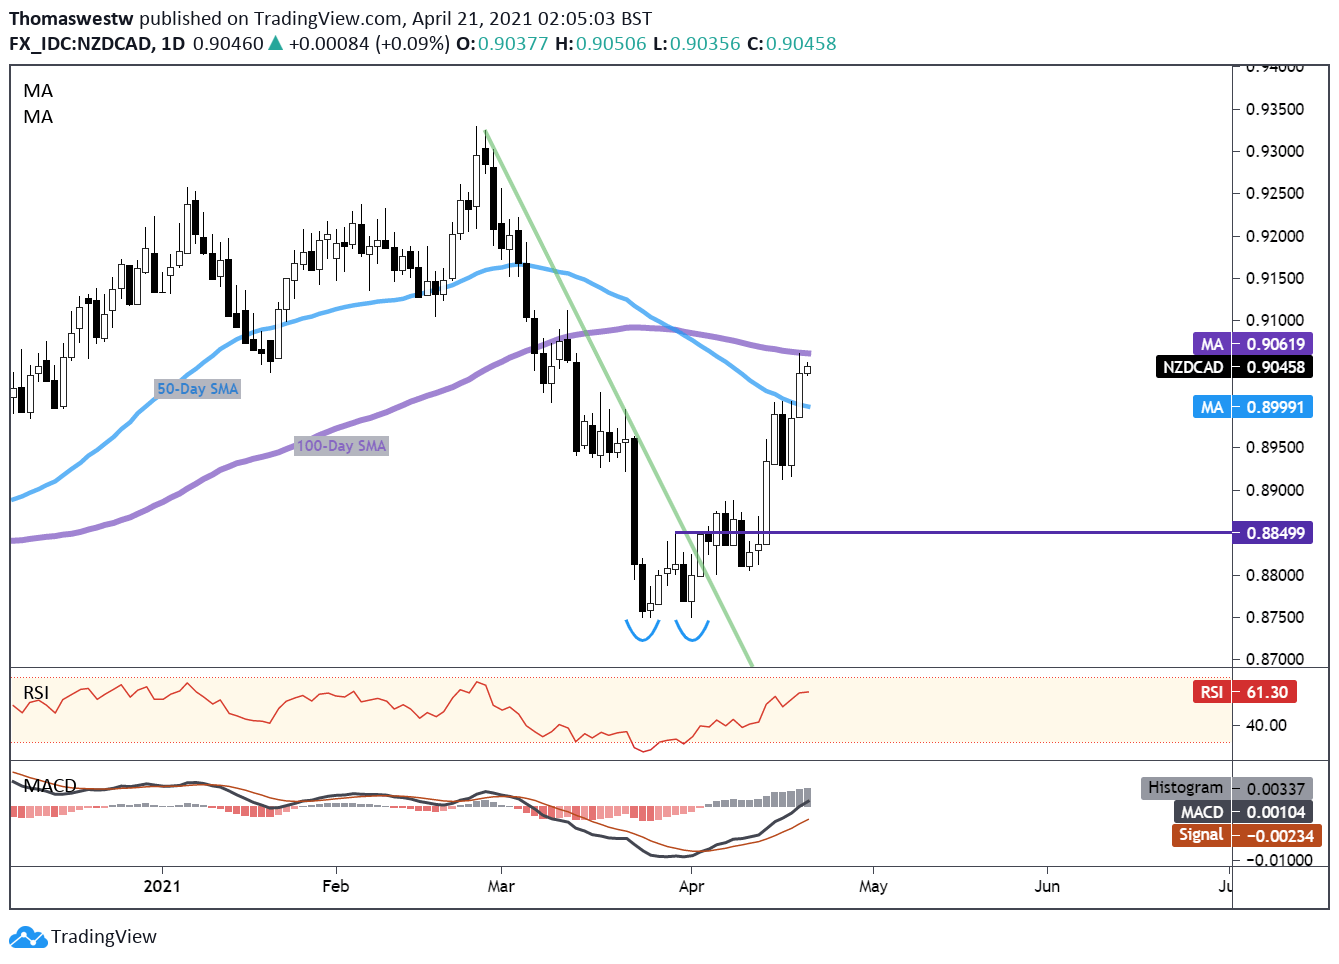
Chart created with TradingView
NZD/JPY Technical Breakdown
The safe-haven Japanese Yen has proven more resilient against the New Zealand Dollar. Still, NZD/JPY has trended modestly higher, although it remains below a key trendline from October. That trendline has proved to be a resistance point for the currency pair when it turned a 7-day rally lower.
Since then, NZD/JPY found support just below the 77 handle and proceeded to make a higher high. However, strength stalled out before coming in contact with trendline resistance. An intraday move pinged the 78.6% Fibonacci level, with prices now trading above the 50-day SMA. That said, if the recent trend holds, we may see a jump higher to set another higher high.
NZD/JPY Daily Chart
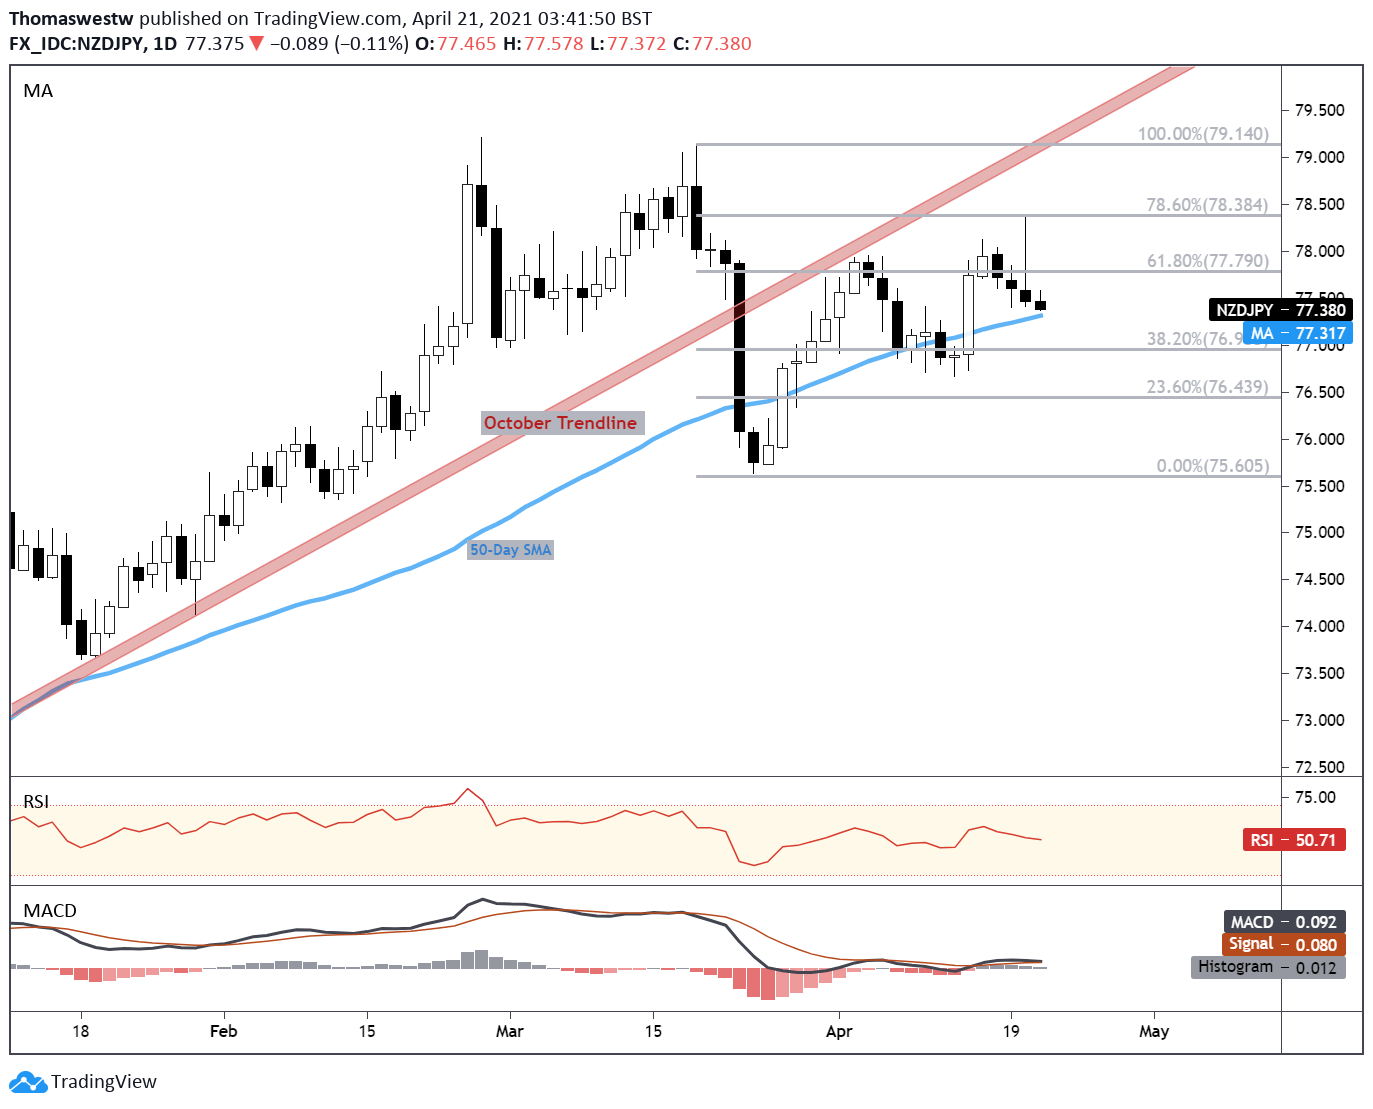
Chart created with TradingView
NZD/USD, NZD/CAD, NZD/JPY TRADING RESOURCES
- Just getting started? See our beginners’ guide for FX traders
- What is your trading personality? Take our quiz to find out
- Join a free webinar and have your trading questions answered
- Subscribe to the DailyFX Newsletter for weekly market updates
--- Written by Thomas Westwater, Analyst for DailyFX.com
To contact Thomas, use the comments section below or @FxWestwater on Twitter


