


S&P 500, EUR/USD, USD/JPY, Technical Analysis, Retail Trader Positioning - Talking Points
- Retail trader positioning signals hint S&P 500 may rise
- The US Dollar may also appreciate against EUR & JPY
- Check out the webinar recording for breakdown of IGCS

In this week’s webinar, I covered the outlook for the S&P 500, EUR/USD and USD/JPY using IG Client Sentiment (IGCS), a tool gauging retail trader positioning. IGCS is typically a contrarian indicator. For further analysis of where these assets may go, including coverage of fundamentals, check out the recording of the session above.
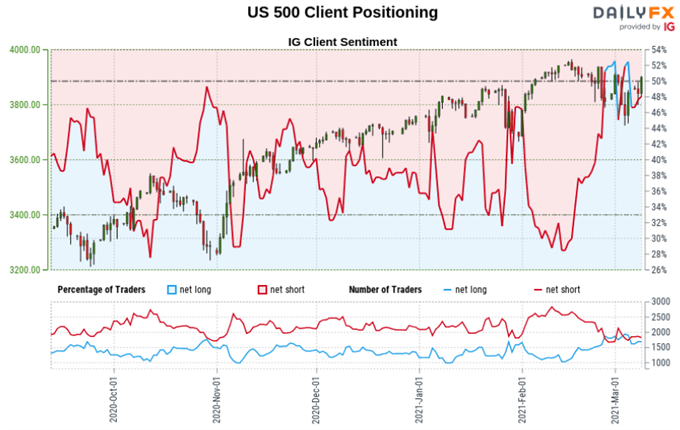
S&P 500 Sentiment Outlook - Bullish
The IGCS gauge implies that about 42% of retail traders are net long the S&P 500. Downside exposure has increased by 13.45% and 7.71% over a daily and weekly basis respectively. From here, the combination of current sentiment and recent changes offers a stronger bullish contrarian trading bias.
Technical Analysis
Rising support from March 2020 continues to uphold the dominant upside bias in the S&P 500, with the 100-day Simple Moving Average sitting just below. Resuming the uptrend entails a push above the February high at 3959, which may act as interim resistance.

S&P 500 Futures Daily Chart

S&P 500 Chart Created in Trading View
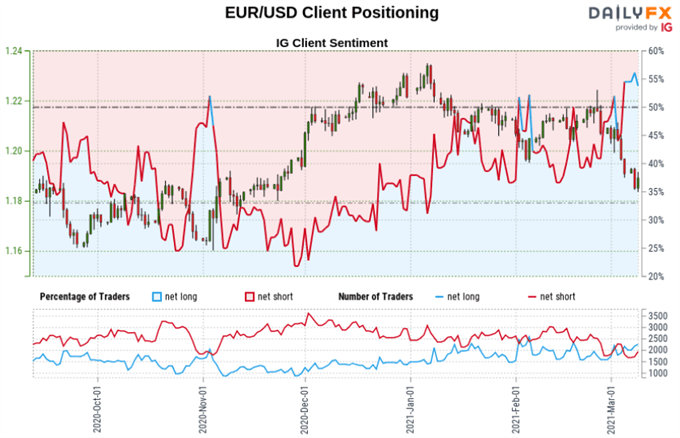
EUR/USD Sentiment Outlook - Bearish
The IGCS gauge implies that about 55% of retail investors are net long EUR/USD. Upside exposure has increased by 10.37% and 20.03% over a daily and weekly basis respectively. From here, the combination of current sentiment and recent changes offers a stronger bearish contrarian trading bias.
Technical Analysis
EUR/USD extended losses under the 1.1932 – 1.2011 inflection zone recently, confirming the break under a rising range of support from June. Yet, prices paused on the 200-day SMA, opening the door to a bounce. However, a break under may open the door to a deeper pullback in the Euro.
EUR/USD Daily Chart
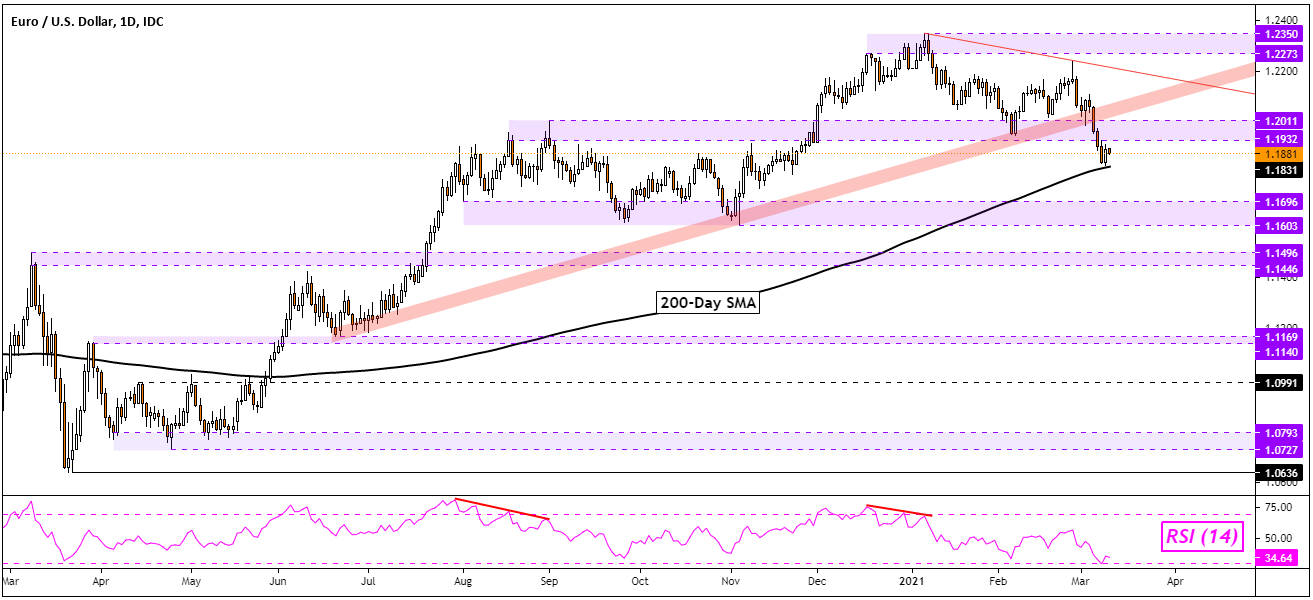
EUR/USD Chart Created in Trading View
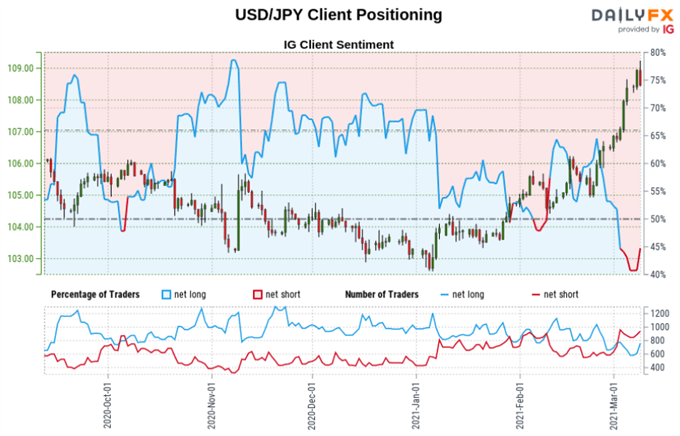
USD/JPY Sentiment Outlook - Bullish
The IGCS gauge implies that roughly 37% of retail traders are net long USD/JPY. Upside exposure has increased by 21.10% and 14.97% over a daily and weekly basis respectively. From here, the combination of current sentiment and recent changes offers a stronger bullish contrarian trading bias.
Technical Analysis
USD/JPY has seen some aggressive gains as of late, surging past the 107.94 – 108.16 resistance zone. Now, prices are sitting right under peaks from June, forming another resistance range between 109.38 and 109.85. There may be an elevated risk to the downside however. For example, reaching the 10-day SMA entails a decline of over 1% at the time of publishing. This is as rising support from January could yet maintain the key uptrend.
USD/JPY Daily Chart

USD/JPY Chart Created in Trading View
*IG Client Sentiment Charts and Positioning Data Used from March 10th Report
--- Written by Daniel Dubrovsky, Strategist for DailyFX.com
To contact Daniel, use the comments section below or @ddubrovskyFX on Twitter


