


Dow Jones, S&P 500, Technical Analysis, Retail Trader Positioning - Talking Points
- IG Client Sentiment warns that the Dow Jones and S&P 500 may fall
- Upside momentum seems to be fading, raising the risk of a turn lower
- Check out the webinar recording for an in-depth breakdown of IGCS

In this week’s webinar, I covered the outlook for equities like the Dow Jones and S&P 500 using IG Client Sentiment (IGCS). IGCS is typically a contrarian indicator. For a more in-depth analysis of where these assets may go, including coverage of fundamentals, check out the recording of the session above.
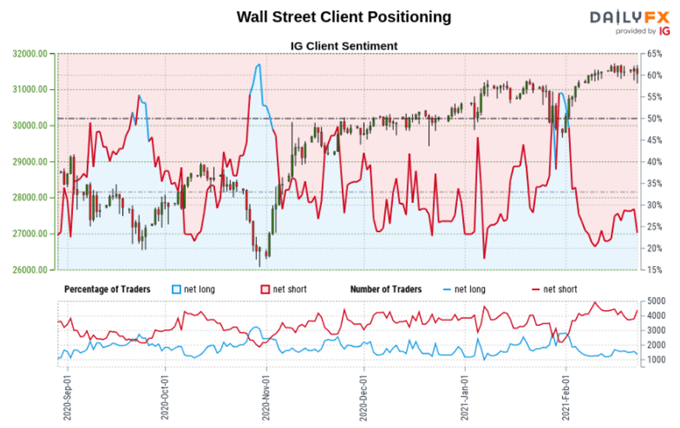
Dow Jones Sentiment Outlook - Bearish
The IGCS gauge implies that about 31% of retail traders are net long the Dow Jones. Downside exposure has decreased by 13.02% and 11.05% over a daily and weekly basis respectively. Recent changes in sentiment warn that the current price trend may soon reverse lower despite the fact traders remain netshort.
Technical Analysis
Negative RSI divergence shows that upside momentum in the Dow Jones is fading. This can at times precede a turn lower. Prices are struggling to push above the 38.2% Fibonacci extension at 31551. Immediate support seems to be at the 31188 inflection point. A turn lower may place the focus on rising support from March.

Dow Jones Futures Daily Chart

Dow Jones Chart Created in Trading View
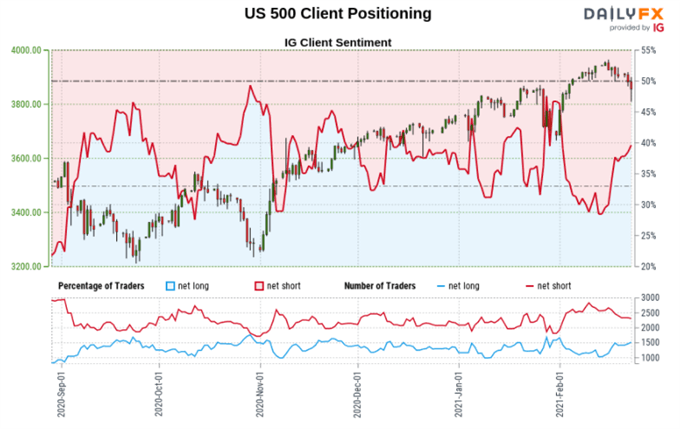
S&P 500 Sentiment Outlook - Bearish
The IGCS gauge implies that roughly 46% of retail traders are net long the S&P 500. Upside exposure has increased by 7.41% and 27.61% over a daily and weekly basis respectively. Recent changes in sentiment warn that the current price trend may soon reverse lower despite the fact traders remain netshort.
Technical Analysis
Negative RSI divergence warns that upside momentum is fading in the S&P 500. Further losses may place the focus on rising support from March – see chart below. A drop through it would expose lows from January. Uptrend resumption, on the other hand, could place the focus on 3975, the midpoint of the Fibonacci extension.
S&P 500 Futures Daily Chart
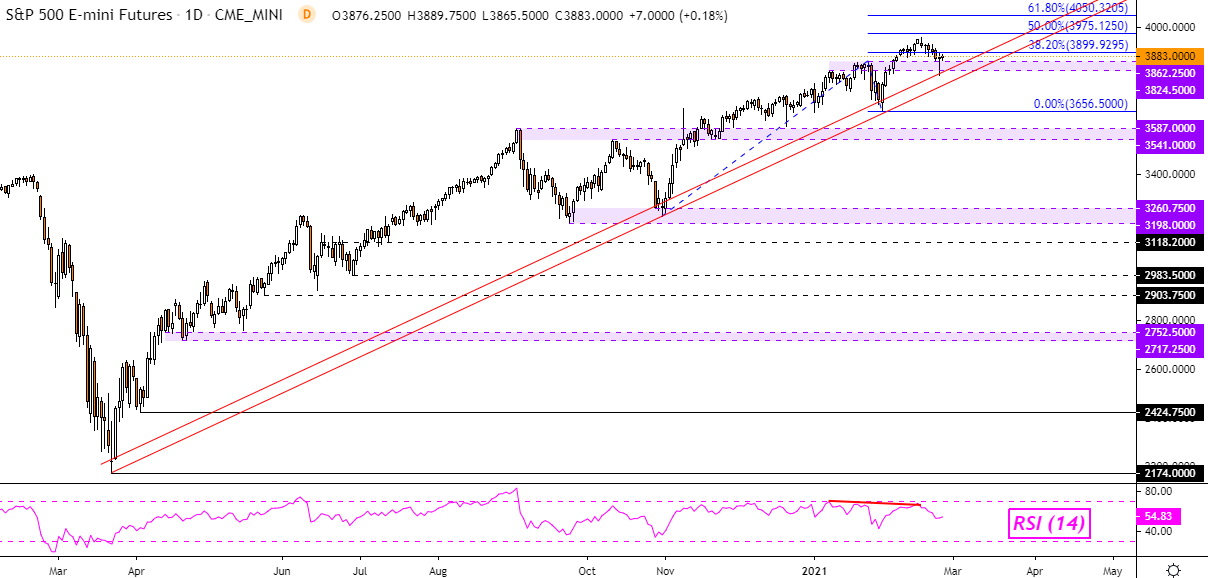
S&P 500 Chart Created in Trading View
*IG Client Sentiment Charts and Positioning Data Used from February 24th Report
--- Written by Daniel Dubrovsky, Strategist for DailyFX.com
To contact Daniel, use the comments section below or @ddubrovskyFX on Twitter


