


US Dollar, EUR/USD, AUD/USD, USD/CAD, Trader Positioning - Talking Points
- Ahead of November 3rd election, how is positioning faring in the US Dollar?
- EUR/USD may extend losses if retail traders increase upside exposure next
- AUD/USD could fall on the other hand, USD/CAD is looking more neutral
With hopes of a fresh US fiscal package now grim ahead of the November 3rd election after policymakers were unable to bridge gaps, how are retail investors positioning themselves in the US Dollar? This can be measured using IG Client Sentiment (IGCS), which is typically a contrarian indicator. Below is an overview of EUR/USD, AUD/USD and USD/CAD using the tool in addition to technical analysis. You may also signup for my webinar below where I discuss IGCS while also incorporating aspects of fundamental analysis.
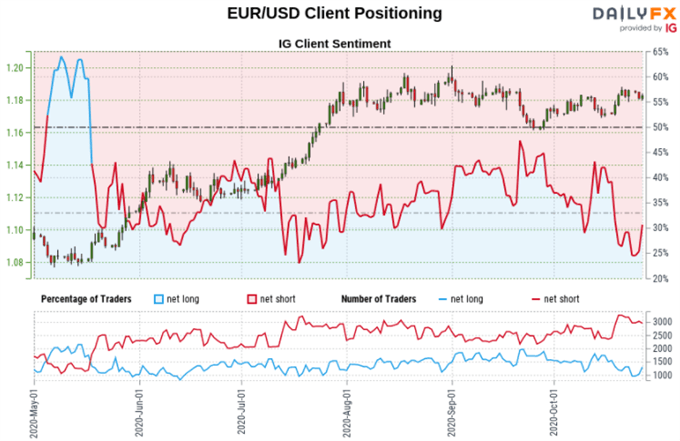
Euro Sentiment Outlook - Bearish
The IGCS gauge implies that about 30% of retail traders are net long EUR/USD. Upside exposure has increased by 3.85% and 9.19% compared to yesterday and last week respectively. Recent changes in sentiment warn that the current price trend may soon reverse lower despite the fact traders remain netshort. If prices continue falling, retail investors could add upside exposure as they attempt to pick the Euro’s turning point.

Euro Technical Analysis
From a technical standpoint, EUR/USD remains in a consolidative setting. This has been persisting since late July when the Euro transitioned from gradually gaining against the US Dollar and into a holding pattern. The zone of support seems to sit between 1.1612 and 1.1696 while resistance at 1.1932 to 1.2011. There seems to be a short-term rising trendline brewing since late September with immediate resistance at 1.1860.
EUR/USD – Daily Chart

Euro Chart Created in Trading View
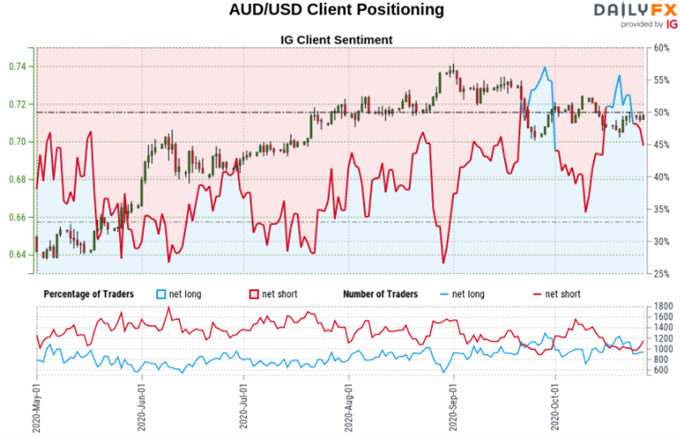
Australian Dollar Sentiment Outlook - Bullish
The IGCS gauge implies that roughly 44% of retail investors are net long AUD/USD. Downside exposure has increased 9.95% and 30.33% over a daily and weekly basis respectively. Given the recent changes andcurrent sentiment, these offer a stronger bullish contrarian trading bias. Rising prices may inspire more investors to chase a future top as they increase bets to the downside.

Australian Dollar Technical Analysis
The AUD/USD technical outlook seems tilted to the downside. Prices are trading within a bearish Descending Triangle chart pattern. This is as a bearish ‘Death Cross’ was established in late September when the 20-day Simple Moving Average (SMA) crossed under the 50-day one. A breakout under the triangle where the outer boundary of support seems to be at 0.7006 could reinforce the narrative of a top unfolding since August.
AUD/USD – Daily Chart

Australian Dollar Chart Created in Trading View
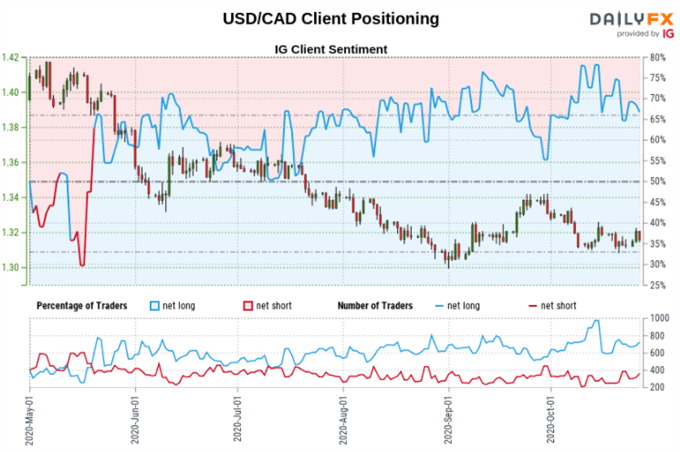
Canadian Dollar Sentiment Outlook - Neutral
The IGCS gauge implies that about 70% of retail traders are net long USD/CAD. Downside exposure has decreased by 11.36% over a daily basis while increased 32.20% compared to last week. The combination of current sentiment and recent changes offers a further mixed trading bias.
Follow me on Twitter @ddubrovskyFX for updates on price trends and retail positioning!
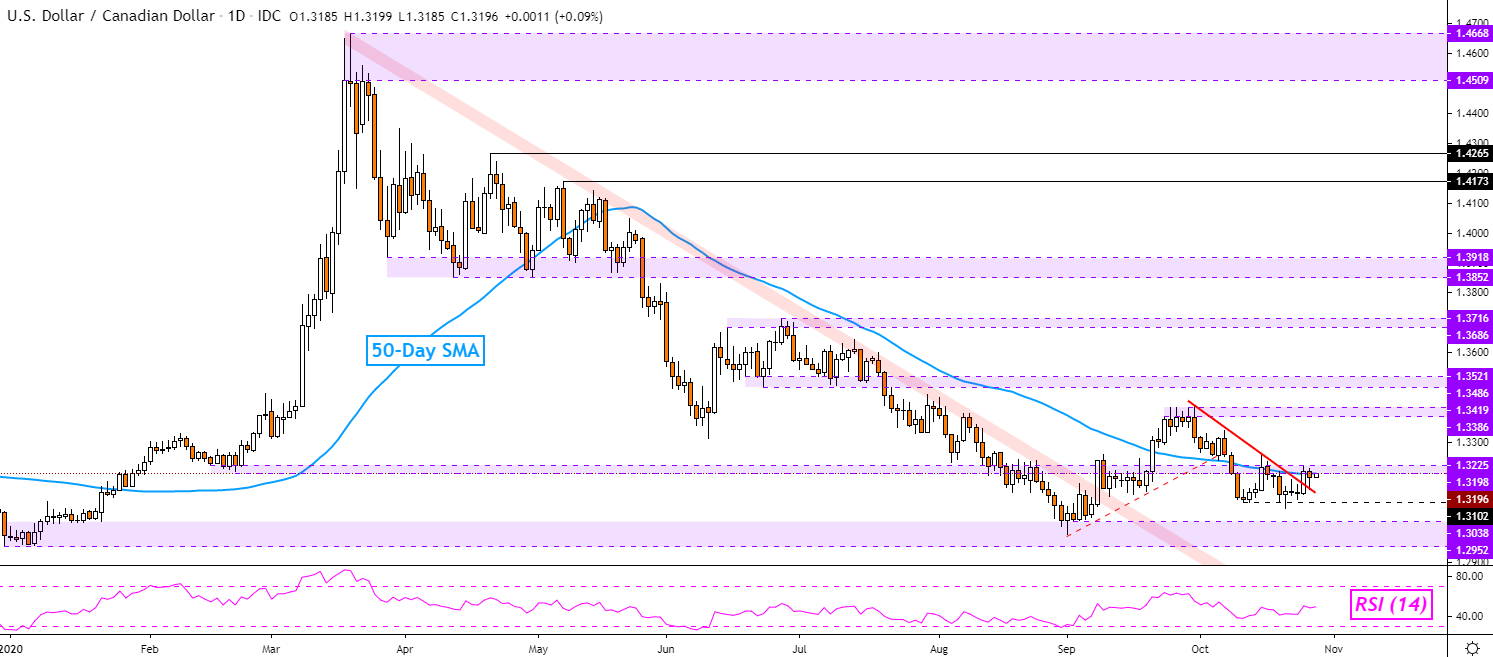
Canadian Dollar Technical Analysis
USD/CAD seems to be struggling to push above a short-term falling trendline from late September. The pair is idling at the 1.3198 – 1.3225 inflection zone as the 50-day SMA holds. A push above these technical barriers exposes peaks from September. Otherwise, resuming losses since then places the focus on current 2020 lows. Getting there entails taking out immediate support at 1.3102.
USD/CAD – Daily Chart
Canadian Dollar Chart Created in Trading View
*IG Client Sentiment Charts and Positioning Data Used from October 27th Report
--- Written by Daniel Dubrovsky, Currency Analyst for DailyFX.com
To contact Daniel, use the comments section below or @ddubrovskyFX on Twitter


