


Indian Rupee, USD/INR, Nifty 50, Technical Analysis - Talking Points
- Indian Rupee may be at risk to the US Dollar ahead
- USD/INR attempting to refocus towards the upside
- Nifty 50 looking increasingly vulnerable to a selloff
Indian Rupee Technical Analysis
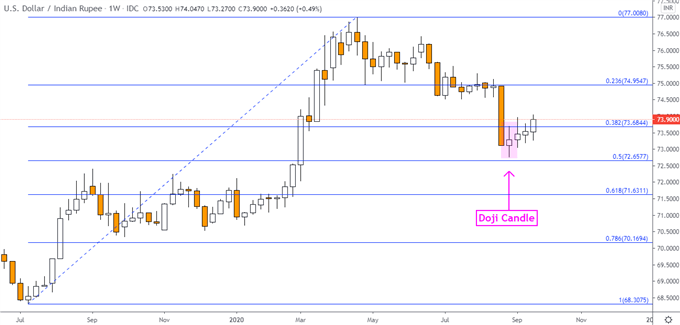
The US Dollar could extend gains against the Indian Rupee. On the weekly chart, USD/INR formed a Doji candlestick earlier this month. This occurred right above the midpoint of the Fibonacci retracement – see chart below. A Doji is typically a sign of indecision. In this case, it formed at potentially the end of a downtrend.
Now, the pair is attempting to push above the 38.2% Fibonacci at 73.6844. Confirming the breakout exposes the 23.6% Fibonacci retracement at 74.9547. On the other hand, resuming the downtrend entails a push under the Doji. Which way might the Indian Rupee go in the near term?

USD/INR Weekly Chart
USD/INR Chart Created in TradingView
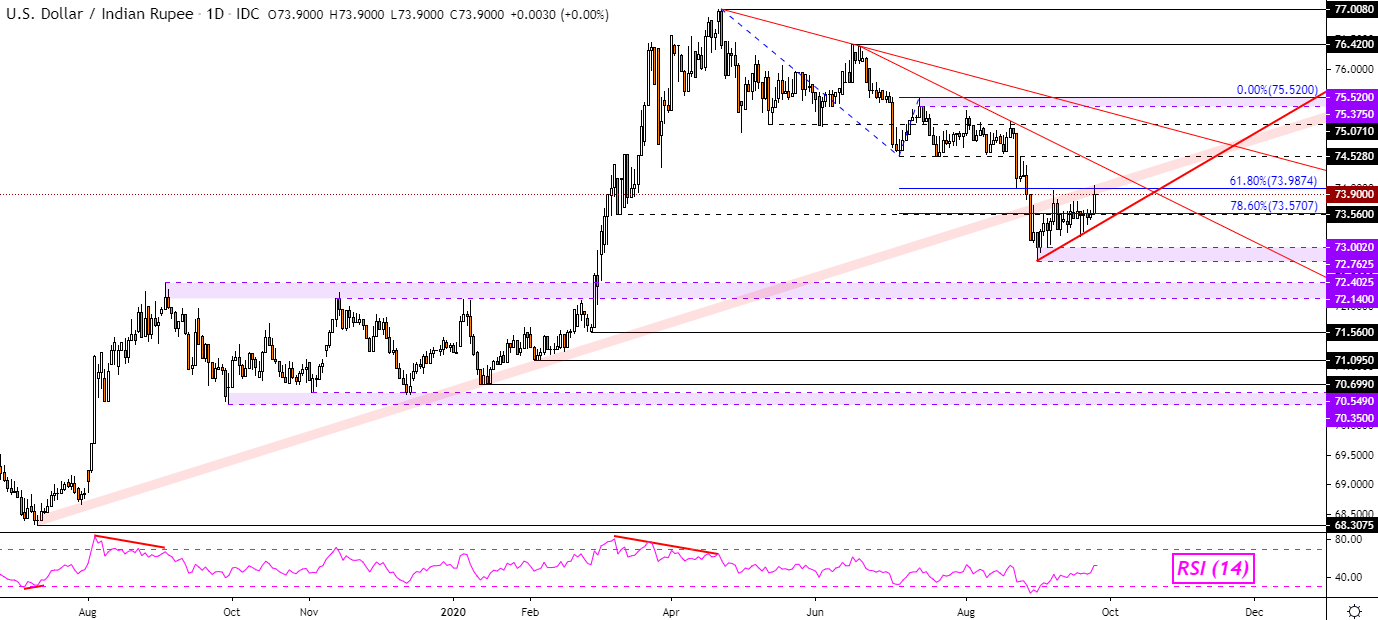
Zooming in on the daily chart reveals a somewhat difficult road ahead. USD/INR still continues to trade under former rising support from July 2019. The breakout under it back in late August was a significant technical achievement. Yet, the pair was unable to find downside confirmation. Now, the trendline seems to be holding as new resistance. Beyond that sits falling resistance from June.
At the same time, keeping the focus towards the upside in the near term seems to be rising support from the beginning of September. If USD/INR falls back under it, the focus for the pair could shift back towards the downside. Otherwise, a climb above the former rising trend line and beyond falling resistance from June may open the door to extending gains.
USD/INR Daily Chart
USD/INR Chart Created in TradingView
Nifty 50 Technical Analysis
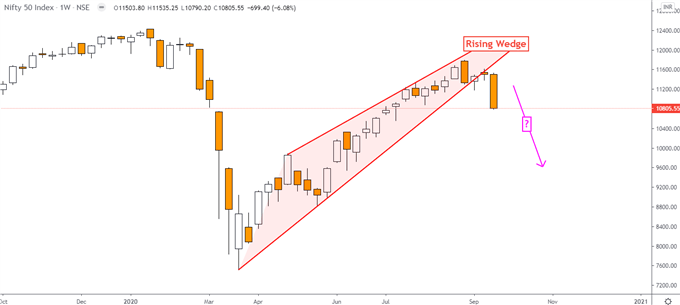
The Nifty 50, India’s benchmark stock index, may be at risk to deeper losses ahead. On the weekly chart below, the Nifty broke under a bearish Rising Wedge chart pattern. This has opened the door to unwinding the bounce from March’s bottom.
Nifty 50 Weekly Chart
Nifty 50 Chart Created in TradingView
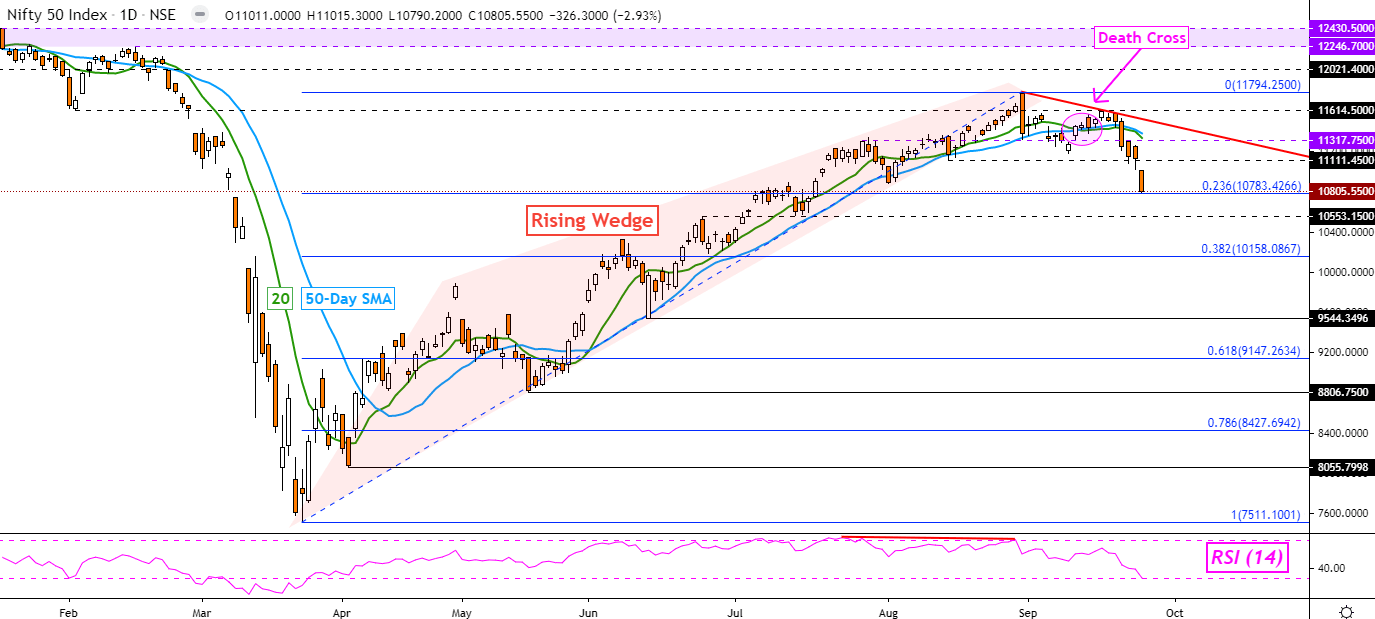
Zooming in on the daily chart shows another bearish technical warning. Earlier this month, the short-term 20-day Simple Moving Average (SMA) crossed under the medium-term 50-day SMA. This is called a ‘Death Cross’ which can at times precede a turn lower. Since then, the Nifty 50 has confirmed the downside breakout.
Prices stopped on the 23.6% Fibonacci retracement on September 24th, establishing support at 10783. A further downside close exposes the 10553 inflection point from June. Beyond that sits the 38.2% level at 10158. In the event of a turn higher, keep an eye on falling resistance from August – red line below.
Nifty 50 Daily Chart
Nifty 50 Chart Created in TradingView
--- Written by Daniel Dubrovsky, Currency Analyst for DailyFX.com
To contact Daniel, use the comments section below or @ddubrovskyFX on Twitter


