


BTC/USD Price Technical Outlook
- (BTC) price chart exposes a possible reversal
- Neutral outlook while below $11,093
BTC/USD – Bulls in Charge
Last week, Bitcoin hit a near 12-month high of $11,447, then closed a weekly candlestick in the green with a 17.8% gain.
Alongside that, the Relative Strength Index (RSI) remained in overbought territory emphasizing the strength of the bullish momentum.
Bitcoin PRICE DAILY CHART (April 1, 2019 – August 7, 2020) Zoomed Out
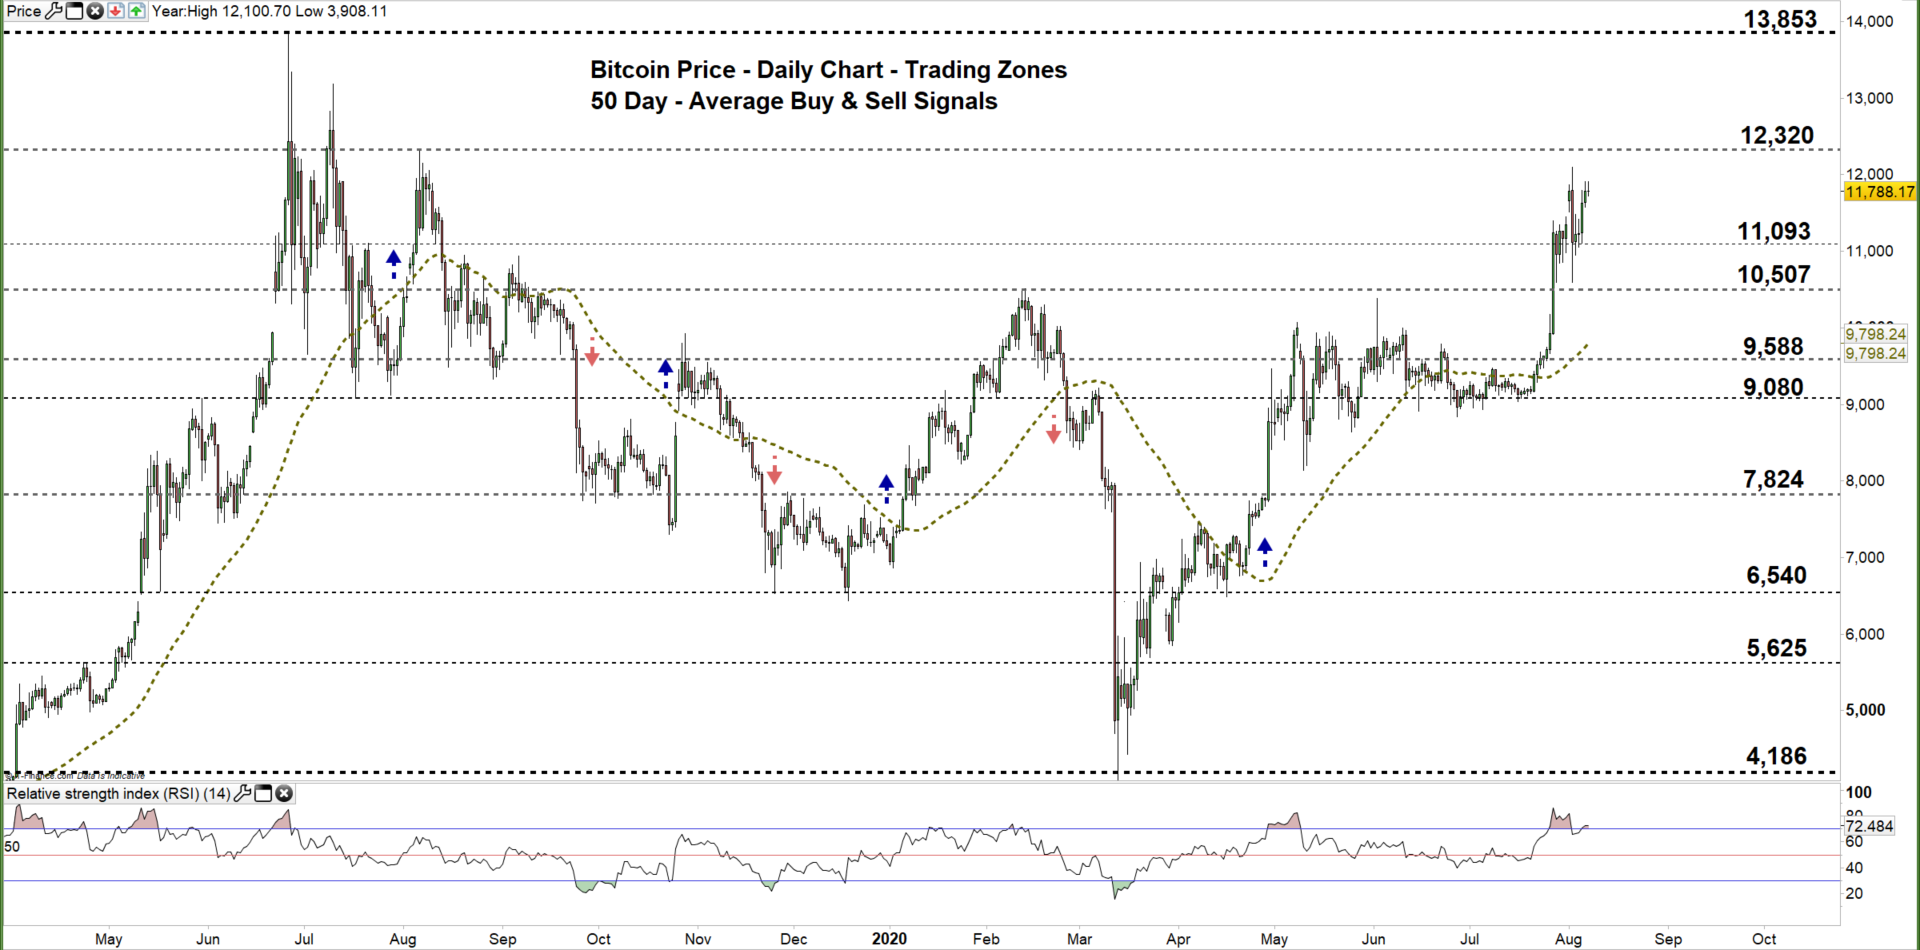

Bitcoin PRICE DAILY CHART (July 12 – August 7, 2020) Zoomed In

On July 27, Bitcoin climbed to the current $11,093 - $12,320. Since then, price has failed on multiple occasions to break through the lower trading zone, repeatedly rebuffing efforts to put bears back in charge.
However, it is important to note the price and RSI divergence as the former created a higher high, while the latter created a lower high, signaling a possible reversal of the upward trend.
A daily close below the low end of the current trading zone may guide Bitcoin’s fall towards the weekly support level at $10,507 (November 2019 high).
On the other hand, a daily close above the high end of the zone could encourage bulls to extend the rally towards the monthly resistance level at $13,853 ( June 2019 High).

Bitcoin PRICE FOUR Hour CHART (June 27 – August 7, 2020)
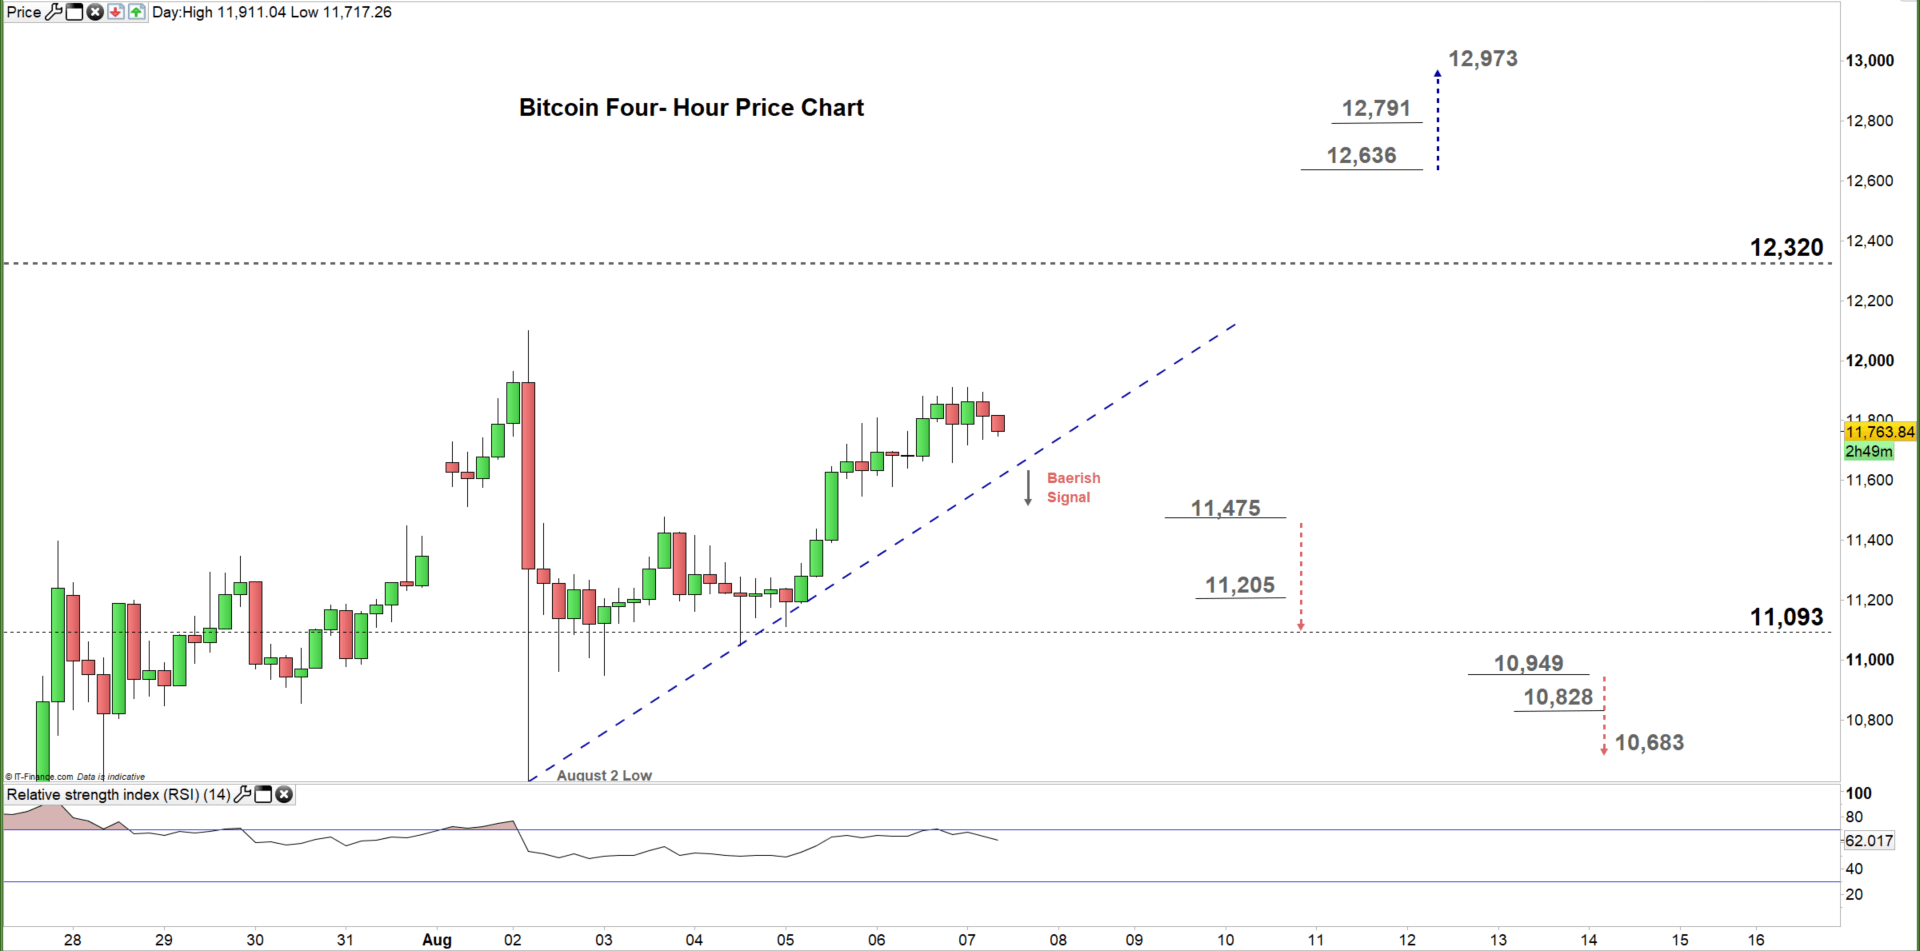
On Wednesday, the price rebounded from the bullish trendline support originated from the August 2 low at $10,589 indicating that bullish momentum remained intact.
To conclude, while bulls still have the upper hand the price/RSI divergence provides a good base of a possible reversal. Therefore, a break below $11,475 may send BTC/USD towards the low end of the current trading zone discussed above on the daily chart at $11,093, while a break above $12,636 may trigger a rally towards $12,973. As such, the weekly support and resistance levels underscored on the four-hour chart should be monitored.

Written By: Mahmoud Alkudsi, Market Analyst
Please feel free to contact me on Twitter: @Malkudsi


