


ETH/USD Technical Forecast
- Positive outlook while above $417.4
- Ethereum price chart highlights a continuation pattern
Ethereum – Edged Higher
Last week, Ethereum hit an over 13-month high of $348.2 then closed a weekly candlestick in the green with a near 21.0% gain.
This week, the Relative Strength Index (RSI) has remained in overbought territory emphasizing the strength of the bullish momentum
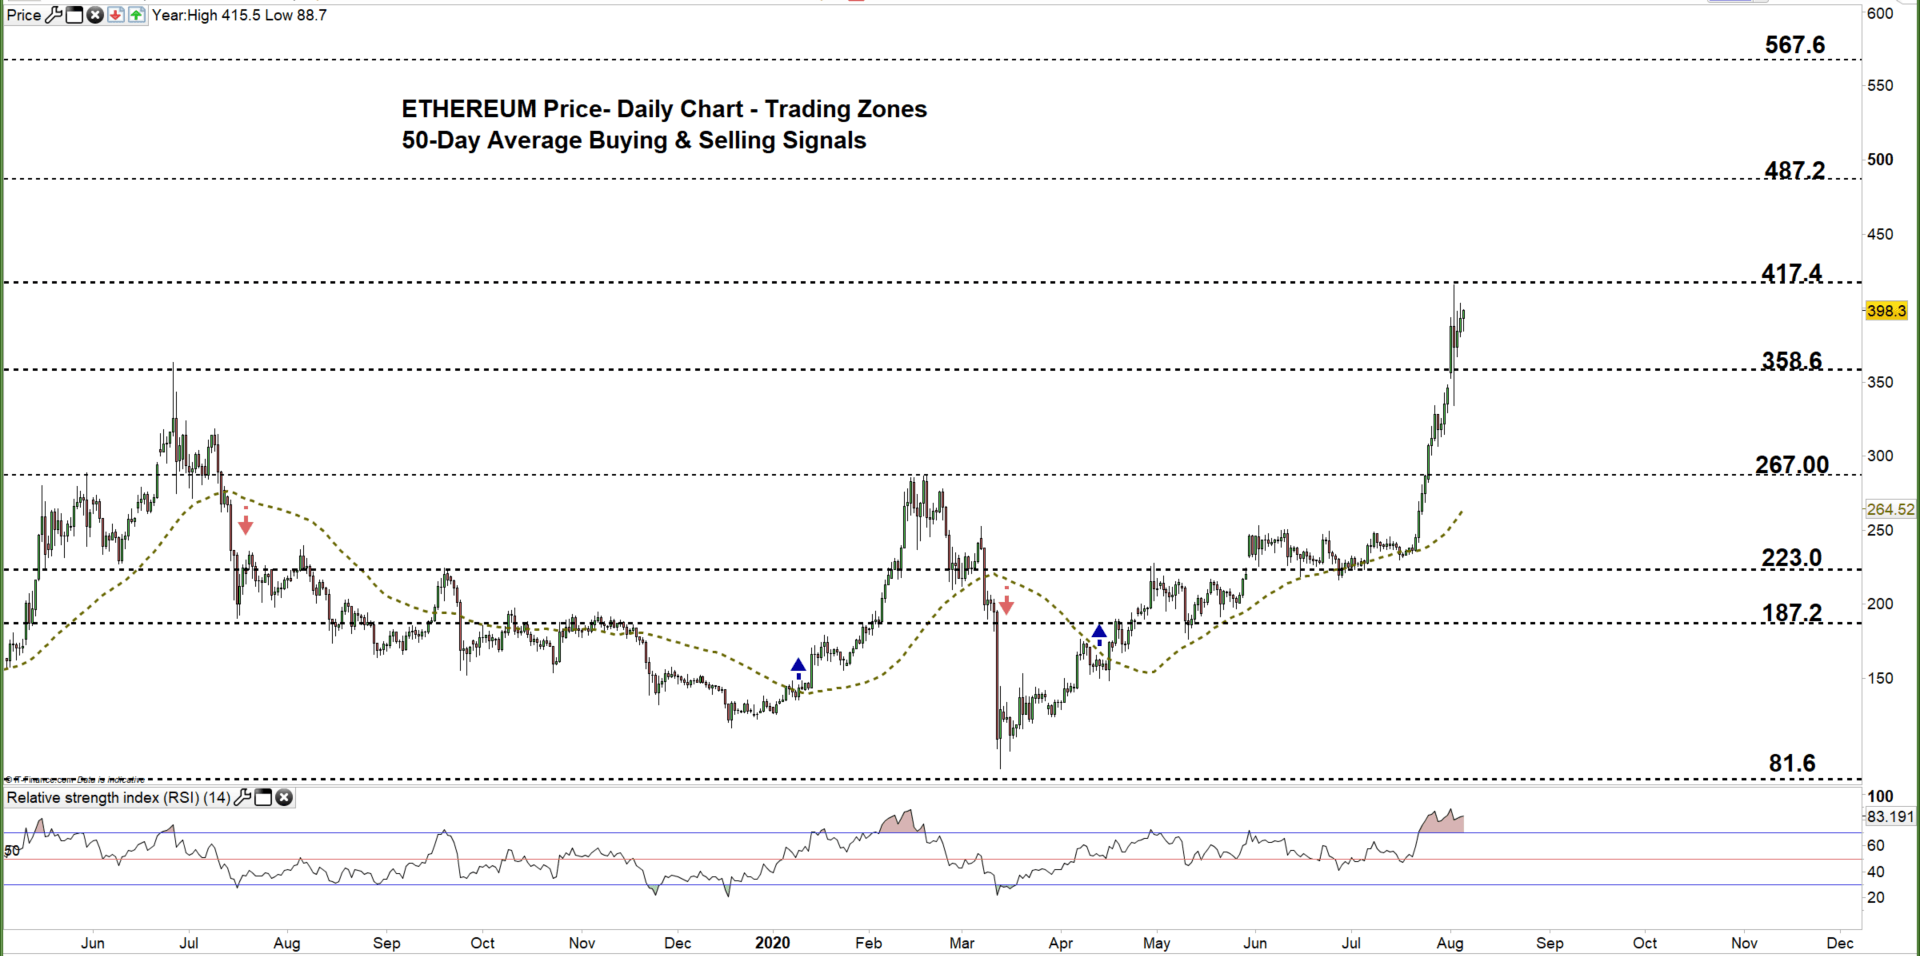
Ethereum Daily PRice CHART (May 20, 2019 – August 5, 2020) Zoomed Out

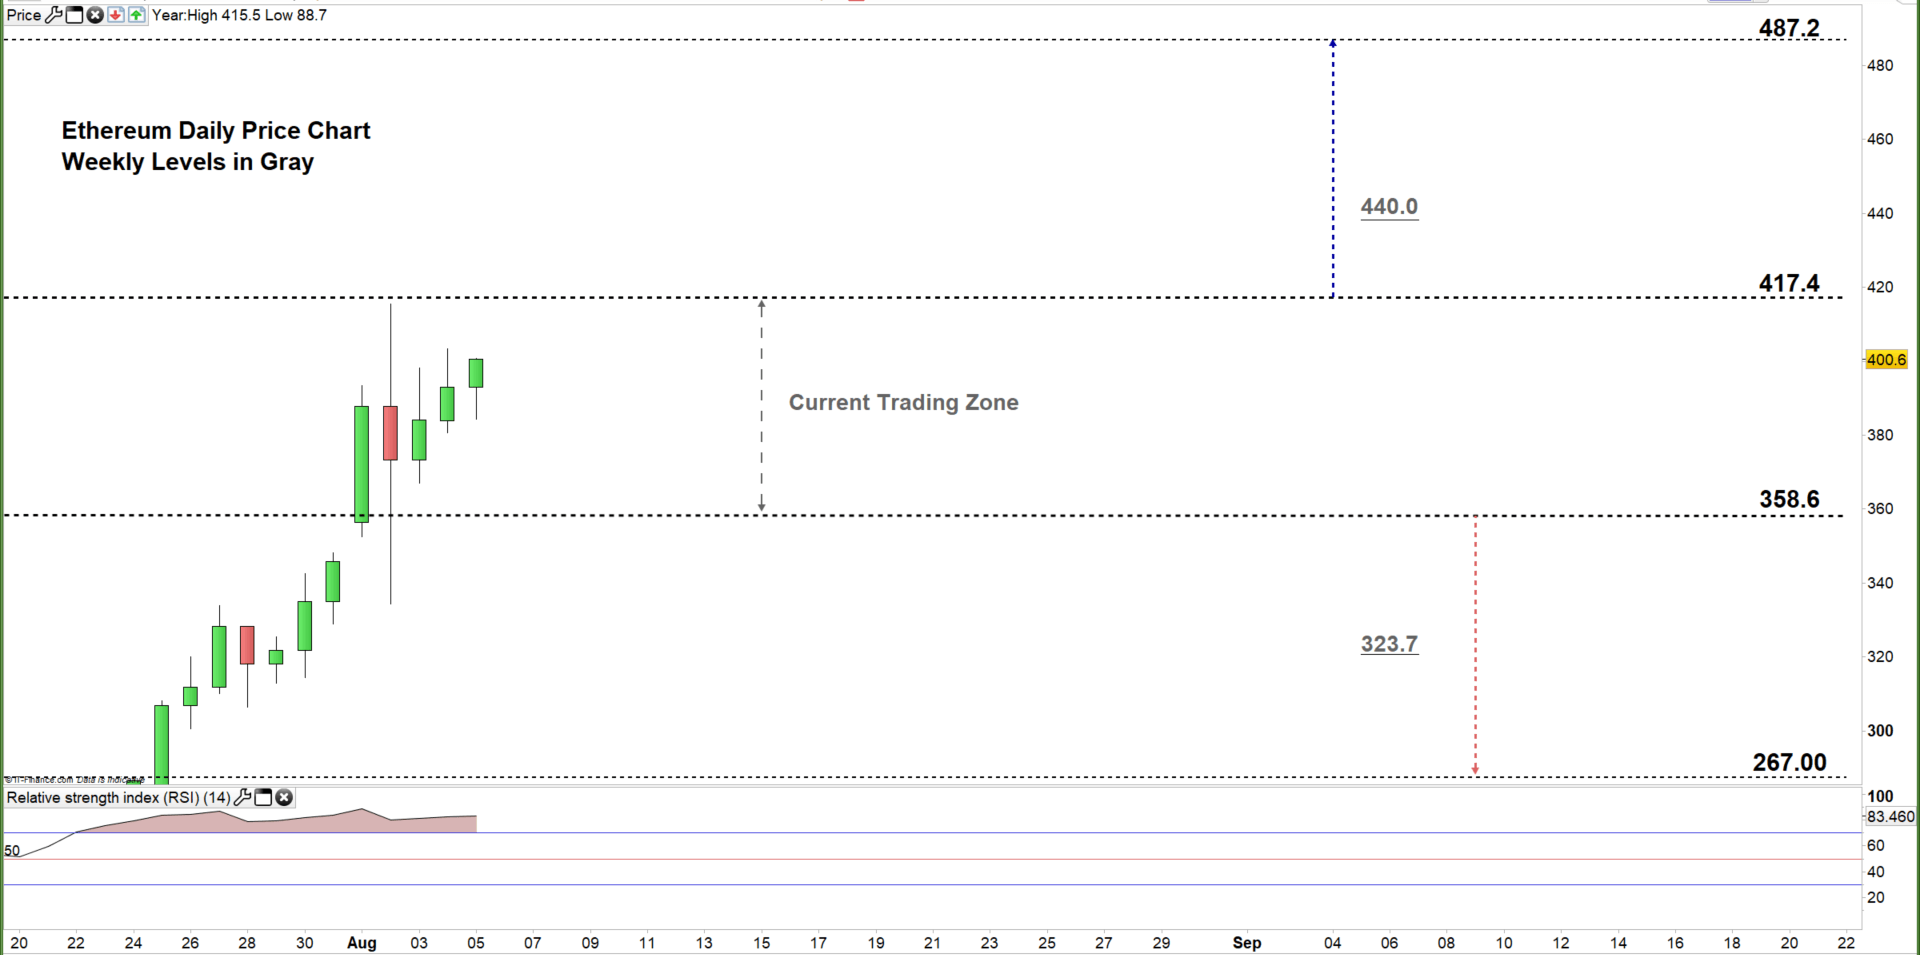
Ethereum Daily PRice CHART (AUG 25 – August 5, 2020) Zoomed In
On Saturday, Ethereum opened with an upward gap then climbed to the current $358.6- $417.4 trading zone then on the following day the price hit a two-year high of $415.5 then fell after as some bulls seemed to cut back.
A daily close above the high end of the current trading zone may encourage bulls to extend the rally towards the monthly resistance level at $487.2 ( July 2018 low).
On the other hand, a failure in closing above the high end of the zone reflects bull’s hesitation and may ultimately guide Ethereum’s fall towards the low end of the zone (June 2019 high).

Ethereum Four Hour PRice CHART (July 23 – August 5, 2020)
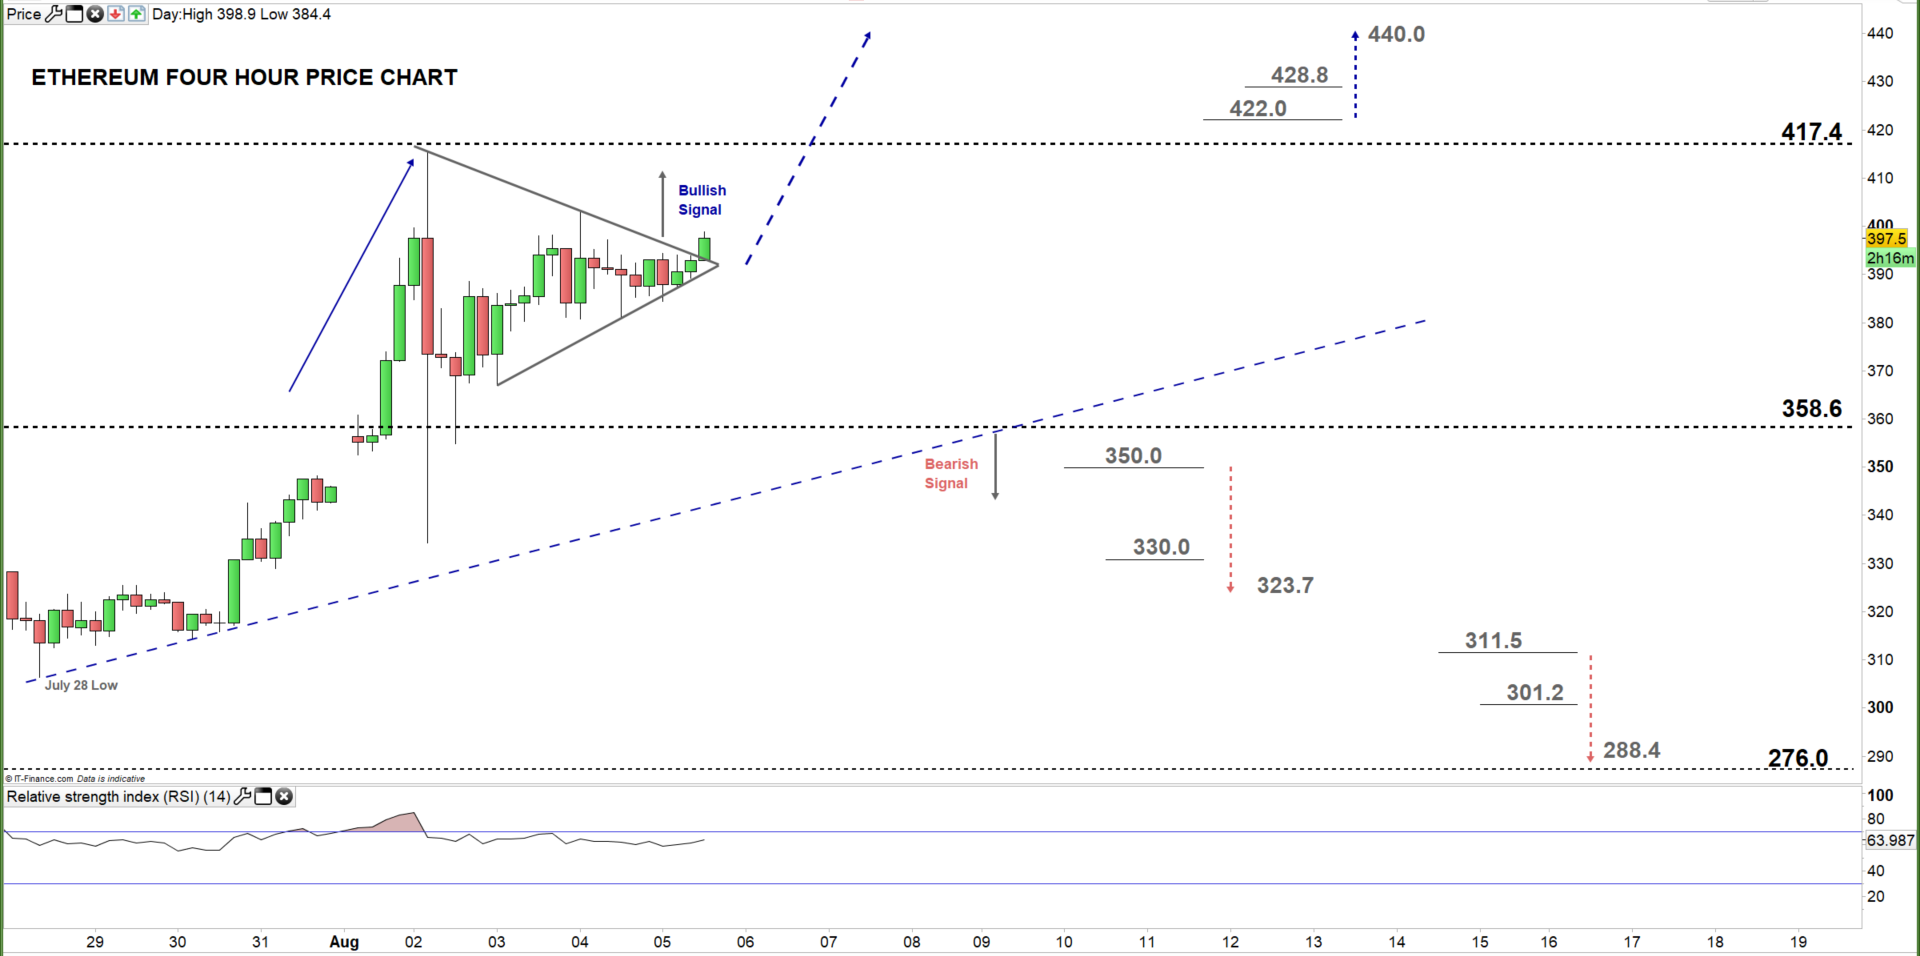
This week, the price paused its upward trend and developed a bullish pennant pattern. Therefore, a break above the higher bound of the pennant indicates a possible continuation of the upward trend.
To conclude, currently the price trades in a sideways move as creates lower highs with higher lows. A break below the bullish trendline support originated from the July 28 low at $306.4 may keep the bearish potential alive.
Therefore, a break below $350.0 could send ETH/USD towards $323.7, while a break above $422.0 may cause a rally towards the $440.0 handle. As such, the support and resistance levels marked on the four-hour chart should be considered.
Written By: Mahmoud Alkudsi
Please feel free to contact me on Twitter: @Malkudsi


