


Ripple Price Technical Outlook
- XRP/USD price- bulls in charge
- Positive outlook while above $0.312
XRP/USD Price - Edged Higher
On Friday, Ripple hit an over five-month high of $0.2570. Ultimately, the price closed a weekly candlestick in the green with a 23.7% gain.
Alongside this, the Relative Strength Index (RSI) remained in overbought territory emphasizing the strength of bullish momentum.
Ripple PRICE DAILY CHART (April 15, 2019 – August 4, 2020) Zoomed Out
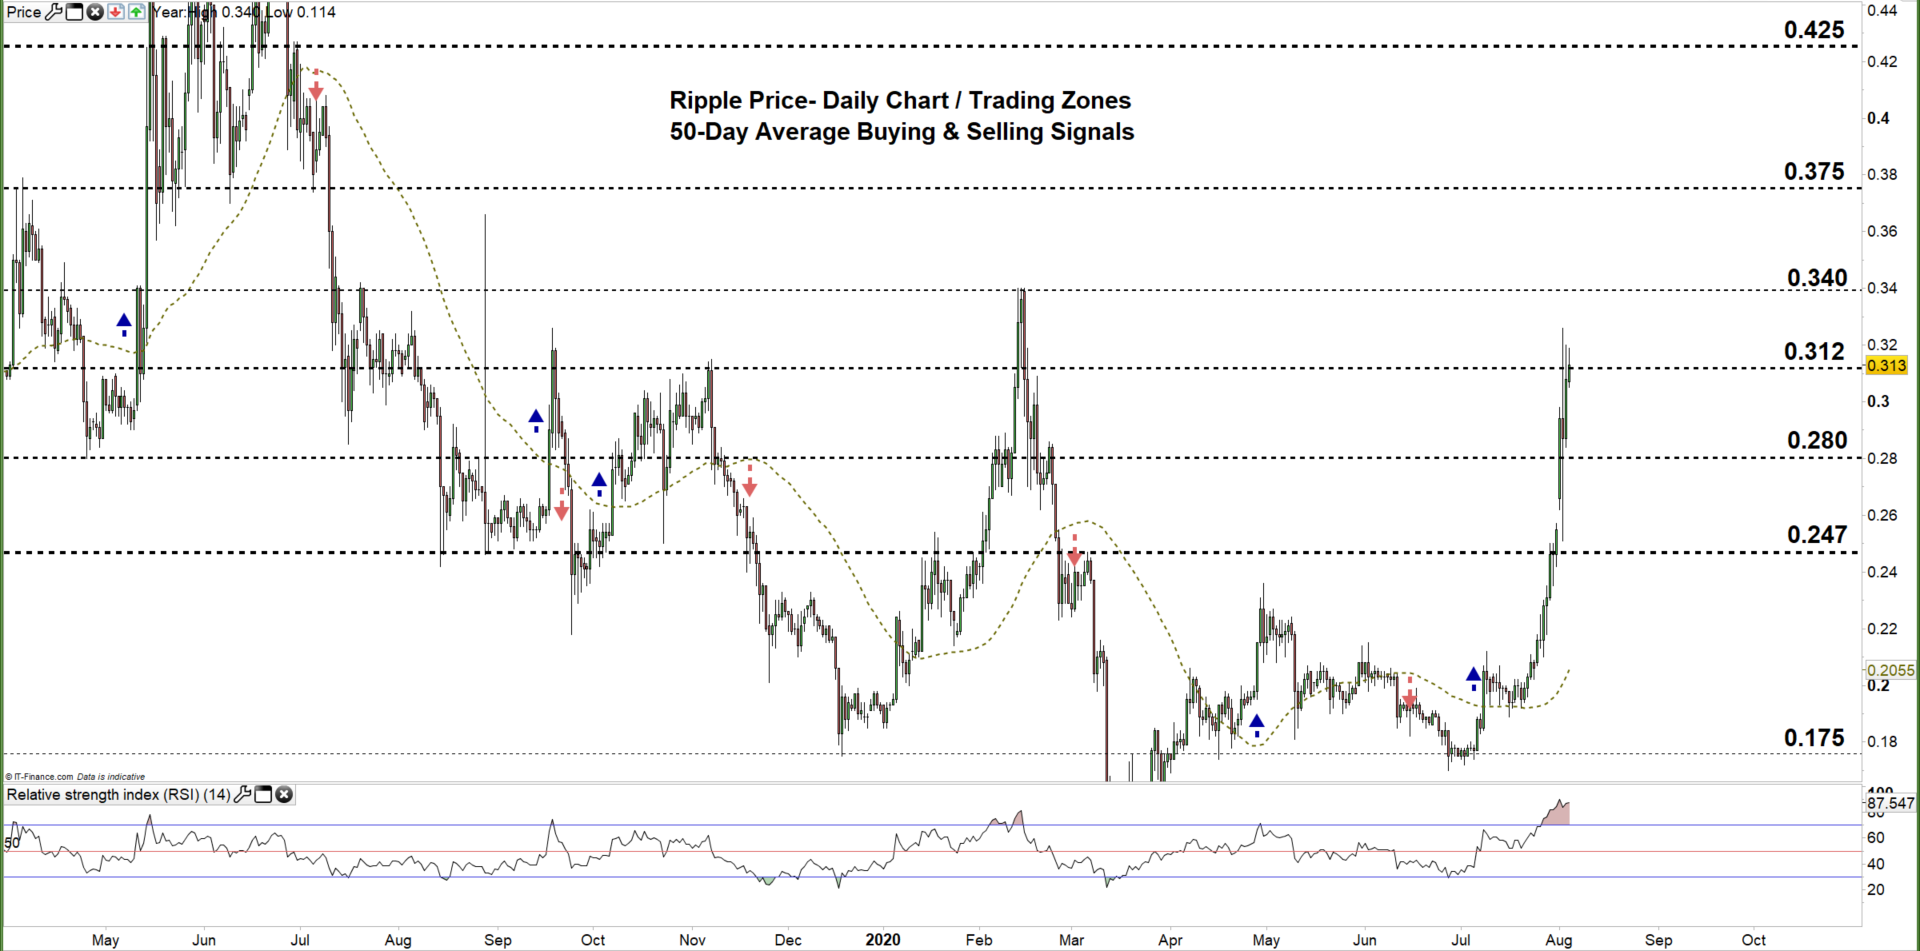

Ripple PRICE DAILY CHART (July 16 – August 4, 2020) Zoomed In

At the start of August, Ripple opened with an upward gap and climbed to the current $0.280-$0.312 trading zone. However, the price failed twice to move to the higher trading zone highlighting hesitant bulls.
Another daily close below the high end of the zone reflects more hesitation and may guide Ripple’s fall towards the low end of the zone (November 2017 high ).
On the other hand, a daily close above the high end of the zone could encourage bulls to extend the rally towards the monthly resistance at $0.340 (February 2020 High).

Ripple PRICE FOUR Hour CHART (July 26 – August 4, 2020)
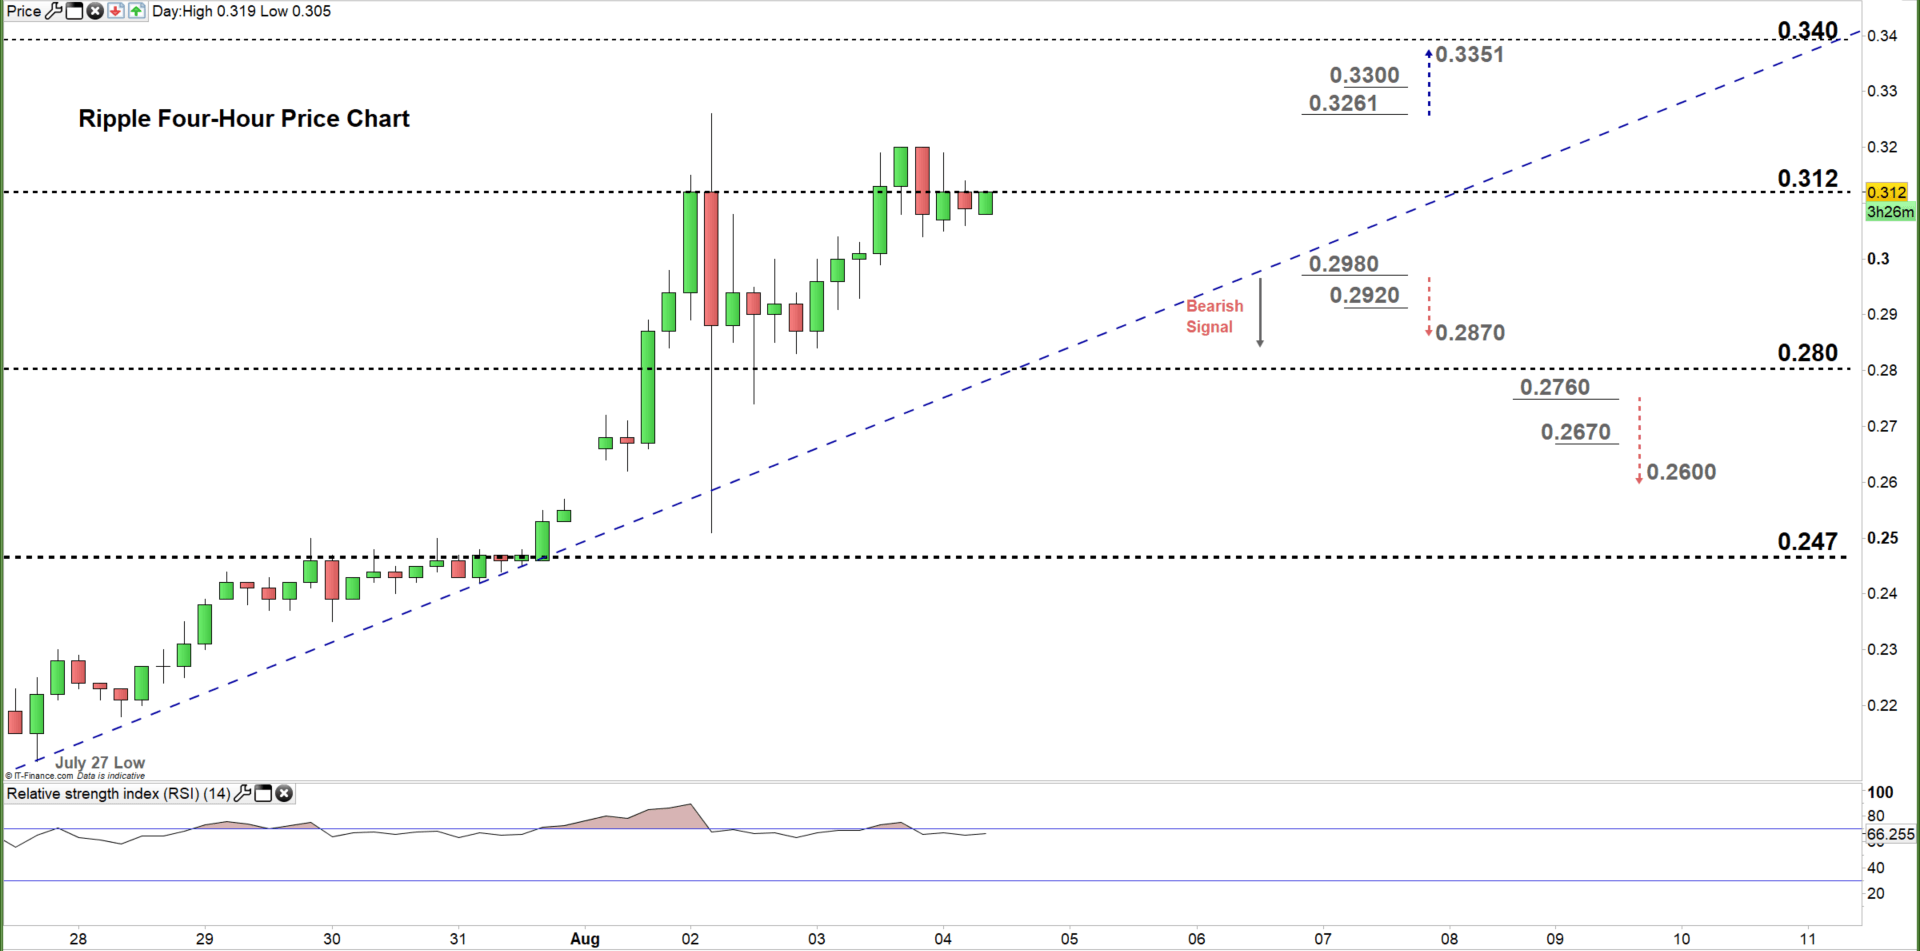
On Saturday, the price tested the bullish trendline support originated from the July 27 low at $0.210 and rallied after indicating that bulls had the upper hand.
To conclude, while bulls remain in charge a break below the aforementioned bullish trendline support reflects a weaker bullish bias. Therefore, a break below 0.2980 may send XRP/USD towards 0.2870, while a break above 0.3261 may cause a rally towards 0.3351. As such, the support and resistance levels marked on the four-hour price chart should be considered.
Written By: Mahmoud Alkudsi,Market Analyst
Please feel free to contact me on Twitter: @Malkudsi


