


Natural Gas Technical Outlook
- Natural gas price climbed to a multi-week high
- Positive outlook while above $2,139
Natural Gas Price – Indecisive Traders
Last week, natural gas hit a three-week high of $1,941 then retreated after as some bulls seemed to cut back. Ultimately, the price closed with a Doji pattern signaling bull’s indecision.
Alongside that, the Relative Strength Index (RSI) declined from 61 to 51 indicating that bulls were in losing momentum.
Nat-Gas DAILY Price CHART (Dec 2, 2018 – August 4, 2020) Zoomed Out


Natural Gas DAILY Price CHART (June 19 – August 4, 2020) Zoomed IN

Yesterday, natural gas opened with an upward breakaway gap indicating that bullish momentum remained intact. The price rallied after to the current $2,050 - $2,139 trading zone then printed a near three-month high at $2,180.
A daily close above the high end of the current trading zone could encourage bulls to extend the rally towards the monthly resistance level at $2,296 (June 2016 low).
On the other hand, a failure in closing above the high end of the zone reflects bull’s hesitation and may guide the price’s fall towards the low end of the zone (March 2016 high).

Natural Gas price Four-Hour PRICE CHART (JULY 7 – August 4, 2020)
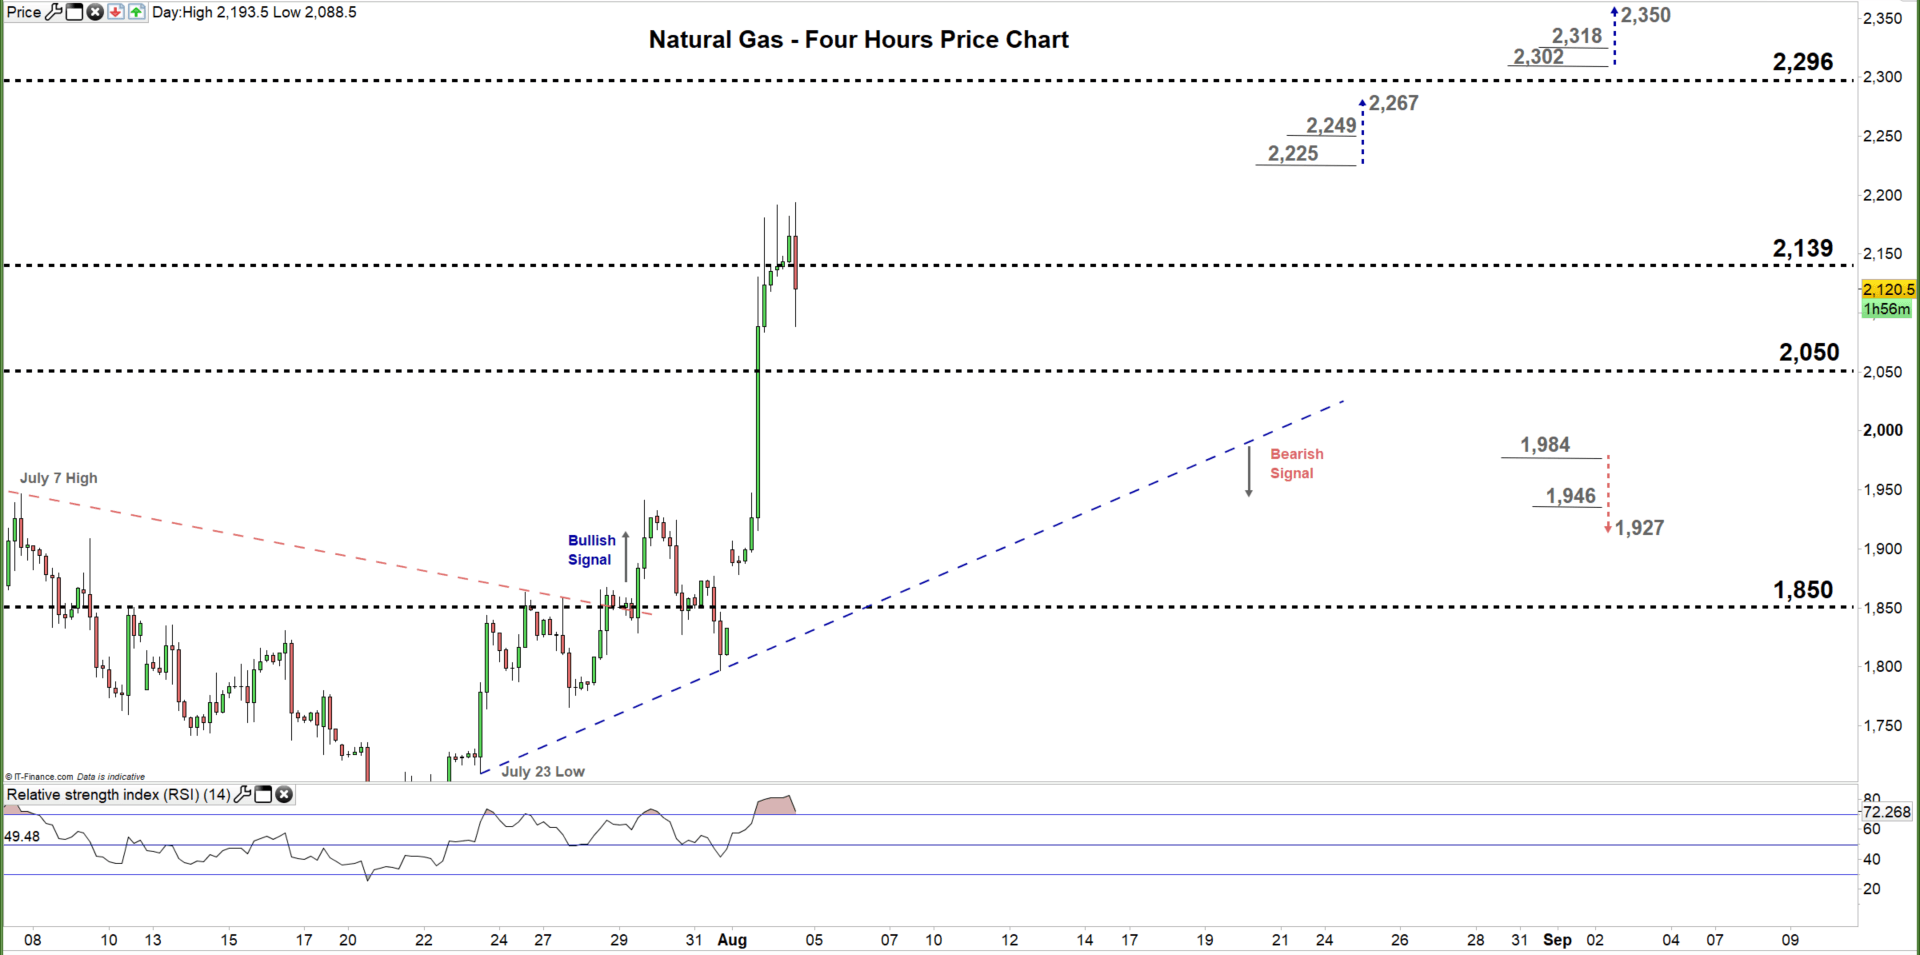
Yesterday, natural gas traded above the bullish trendline support originated from the July 23 low at $1,709allowing bulls to rouse momentum.
To conclude, while bullish bias remains in place a break below the aforementioned upward trendline highlights a weaker bullish sentiment. Therefore, a break below $1,984 could send the price towards $1,927, while a break above $2,225 may cause a rally towards $2,267. As such, the support and resistance levels underscored on the four-hour chart should be kept in focus.
Written By: Mahmoud Alkudsi, Market Analyst
Please feel free to contact me on Twitter: @Malkudsi


