


Gold, XAU/USD, Silver, XAG/USD, Trader Positioning - Talking Points
- IG Client Sentiment warns gold & silver may turn lower
- XAU/USD soars to new all-time high in a volatile session
- XAG/USD technical signals may raise the risk of a drop
Precious metals, such as gold and silver, have recently seen explosive price gains as financial markets continue to expect Treasury yields to remain depressed in the foreseeable future. Now recent changes in IG Client Sentiment (IGCS) warn that XAU/USD and XAG/USD may fall.
IGCS is typically viewed as a contrarian indicator. For a deeper breakdown of the analysis, check out this week’s recording of my webinar on IGCS above. There I discussed the fundamentals and key event risk ahead, such as the Federal Reserve rate decision and key tech earnings from companies like Facebook and Amazon.
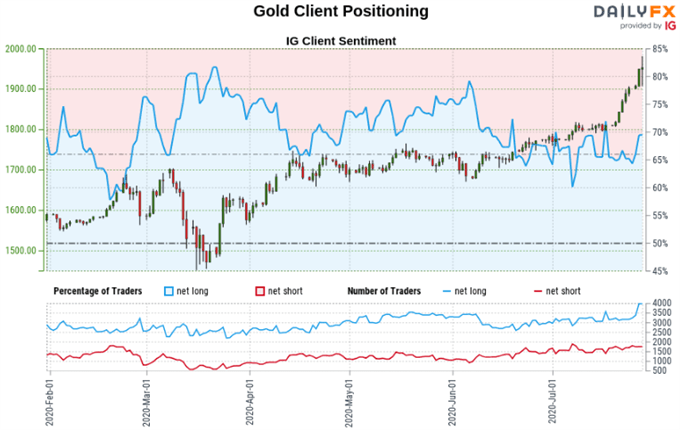
Gold Sentiment Outlook - Bearish
The IGCS gauge implies that 67.85% of retail traders are net long gold. Upside exposure has decreased by 5.48% over a daily basis while rising 16.88% over a weekly one. The combination of current sentiment and recent changes offers a stronger bearish contrarian trading bias for the yellow metal.
Develop the discipline and objectivity you need to improve your approach to trading consistently
Gold Technical Analysis
Gold prices recently surged to an all-time high, taking out the former peak from 2011 at 1920. XAU/USD experienced a volatile session over the past 24 hours, settling in-between the 78.6% and 100% Fibonacci extensions. Guiding the yellow metal higher are two rising trend lines.
One was established in June while the other in the middle of July – red lines on the daily chart below. The latter has a steeper slope which if taken out, could pave the way for a drop to the former. Otherwise, gold may continue venturing to new highs.

XAU/USD – Daily Chart
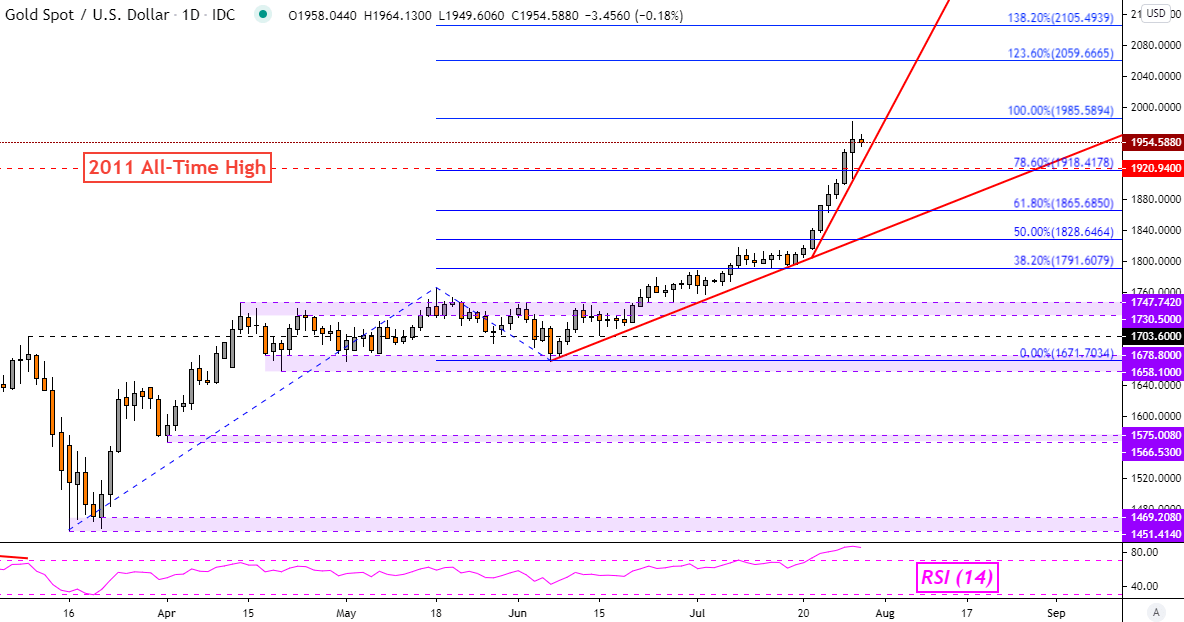
Gold Chart Created in Trading View
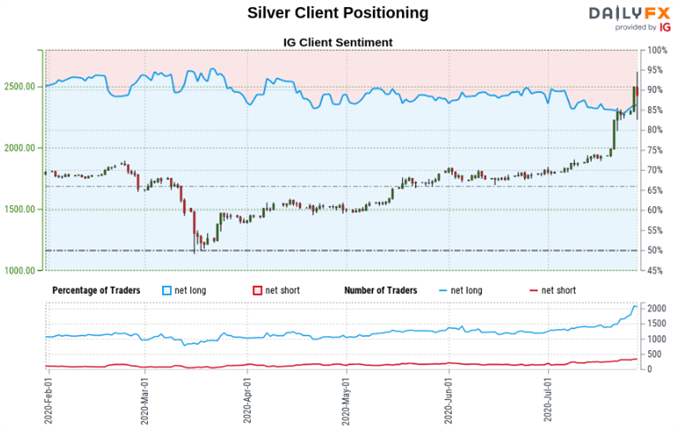
Silver Sentiment Outlook - Bearish
The IGCS gauge implies that 85.96% of silver traders are net long. Net short bets have decreased by 17.17% and 13.83% over a daily and weekly basis. Traders are also further netlong over the same periods, and the combination of current sentiment and recent changes offers a stronger bearish contrarian trading bias.

Silver Technical Analysis
Silver prices swung violently over the past 24 hours, leaving behind a Long-Legged Doji candlestick pattern. This is a sign of indecision that has formed in what could be the peak of XAG/USD’s uptrend. However, much like with gold, two trend lines arguably maintain the bullish bias. The first one was formed in late March.
The second one, which has a steeper slope, formed earlier this month. A daily close under the more recent one could open the door to retesting the rising trend line from March. Negative RSI divergence warns that upside momentum is fading. This can at times precede a turn lower.
XAG/USD – Daily Chart

Silver Chart Created in Trading View
*IG Client Sentiment Charts and Positioning Data Used from July 28 Report
--- Written by Daniel Dubrovsky, Currency Analyst for DailyFX.com
To contact Daniel, use the comments section below or @ddubrovskyFX on Twitter


