


Dow Jones, Nasdaq 100, FAANG, Stocks, Technical Analysis - Talking Points
- FAANG stock valuations to be tested in busy earnings week
- How has the Dow Jones been faring relative to the Nasdaq?
- Critical areas of support maintain bullish biases in indices
So far in July, the Dow Jones Industrial Average has been outperforming the tech-heavy Nasdaq Composite, though this has somewhat reversed course these past couple of trading sessions. This week, key FAANG group members (Facebook, Amazon, Apple and Alphabet) are due to report earnings after lackluster prints from Netflix and Microsoft as these companies defend their relatively elevated stock valuations. Below are key technical levels to watch for ahead.

Dow Jones Technical Analysis
While the Dow Jones (futures below) has yet to retest peaks from June, the overall dominant trend since late March arguably remains bullish. Near term rising support from early May has been guiding the Dow cautiously higher (red line on the daily chart below). The latest bounce may send prices to retest key resistance at 27063 on the way towards 27624. Another key support zone to watch for in the event of a turn lower is the 50-day Simple Moving Average (SMA) which sits just below the rising trend line noted earlier.
| Change in | Longs | Shorts | OI |
| Daily | -18% | 18% | 7% |
| Weekly | -19% | 14% | 4% |
Dow Jones Futures – Daily Chart

Dow Jones Futures Chart Created in Trading View
Nasdaq 100 Technical Analysis
The Nasdaq 100 (futures below) has been idling since prices established critical resistance between 10964 – 11058. Prices wobbled after negative RSI divergence emerged, showing fading upside momentum. This can at times precede a turn lower, but key levels of support maintain the bullish bias. These are a combination of rising support from early April – red parallel lines below – and the 50-day SMA. A daily close under 10301 exposes the latter. Resuming the uptrend exposes the 23.6% Fibonacci extension at 11346.
Nasdaq 100 Futures Daily Chart
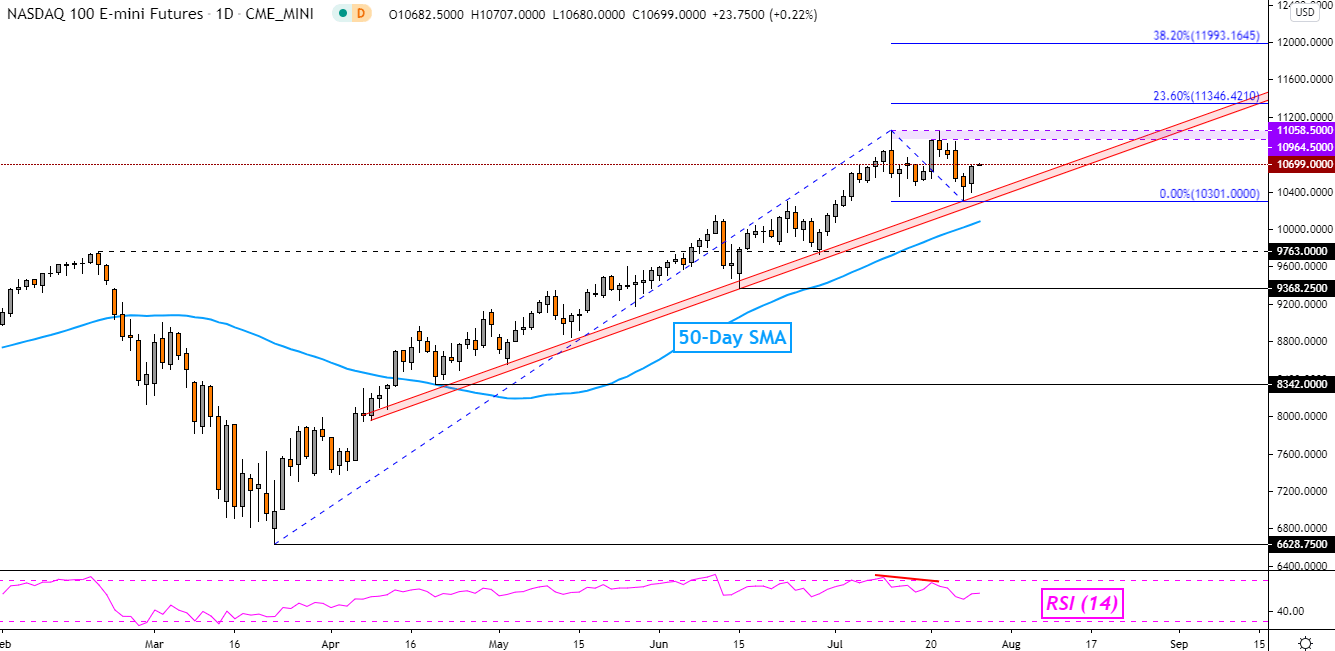
Nasdaq Futures Chart Created in Trading View
FAANG Group Technical Analysis
On the daily chart below is a FAANG Index which averages the price of Facebook, Amazon, Apple, Netflix and Alphabet shares. The FAANG group has averaged a 64.54% rise since bottoming in March compared to the Nasdaq’s 53.80% climb during the same period at the time of writing.
The dominant uptrend in my FAANG index below is being maintained by rising support from March’s bottom – red line. Prices recently bounced after establishing new support as a key range between 1086 to 1108. Resuming gains in these stocks on average entails taking out the ceiling around 1193 to 1229. In the event of soft earnings this week from these tech companies, keep an eye on the 50-day SMA which could keep declines at bay.
FAANG Index Daily Chart
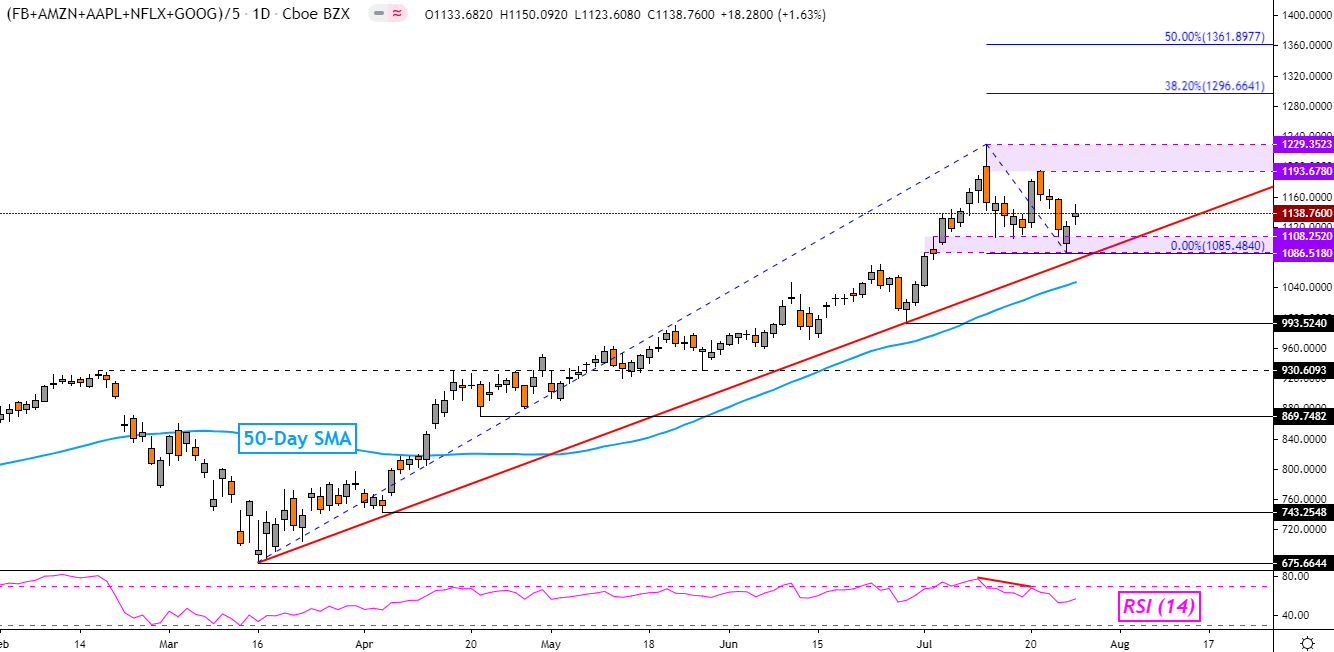
FAANG Index Chart Created in Trading View
*FAANG Index averages Facebook, Amazon, Apple, Netflix and Alphabet shares
--- Written by Daniel Dubrovsky, Currency Analyst for DailyFX.com
To contact Daniel, use the comments section below or @ddubrovskyFX on Twitter


