


US Dollar, USD/IDR, USD/PHP, USD/MYR, USD/SGD – ASEAN Technical Analysis
- USD/IDR gains curbed by 50-day SMA after 20-day taken out
- USD/PHP downtrend resumes, establishing floor at 2017 lows
- USD/MYR may fall as USD/SGD faces key falling tend line next
Indonesian Rupiah Technical Outlook
The US Dollar rose against the Indonesian Rupiah after USD/IDR pushed above the 20-day simple moving average (SMA). However, further gains were curbed by the 50-day SMA as well as direct intervention from the Bank of Indonesia, as expected. The latter may step in should IDR keep weakening. Key resistance sits above as highs from May 2019 (14484 – 14525). A turn lower here would place the focus on the 20-day SMA as well as the 78.6% Fibonacci retracement level at 14240. Downtrend resumption entails falling under 13935.

USD/IDR Daily Chart
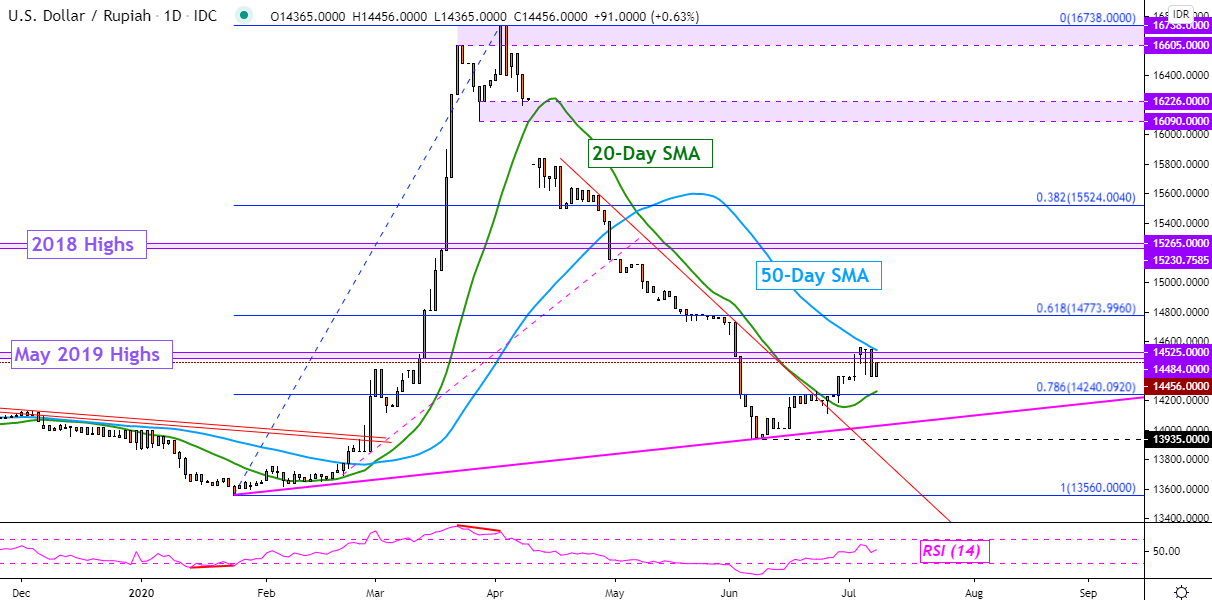
USD/IDR Chart Created in TradingView
Philippine Peso Technical Outlook
The Philippine Peso extended gains against the US Dollar as USD/PHP overcame fading downside momentum warning signs. As the pair fell through the 2018 low, prices paused declines on the 2017 floor (49.26 – 49.37). This area seems to have established itself as key support. Falling through here opens the door to testing the 61.8% Fibonacci extension at 48.93. The slope of depreciation seems to be guided by a falling support line from May. Overturning the downtrend entails taking out falling resistance from March.
Find your trading personality and optimal forms of analysis
USD/PHP Daily Chart

USD/PHP Chart Created in TradingView
Malaysian Ringgit Technical Outlook
The US Dollar could be at risk to the Malaysian Ringgit after USD/MYR closed under the 20-day SMA, opening the door to a near term bearish technical bias. A close under 4.2650 could set the pair to retest lows from June (4.2350 – 4.2450). Confirming a break under this area exposes the March low at 4.1600. In the event of a turn higher from here, keep a close eye on the falling trend line from March – red line. That, as well as the 4.2930 – 4.3030 inflection range, could keep further gains at bay.

USD/MYR Daily Chart
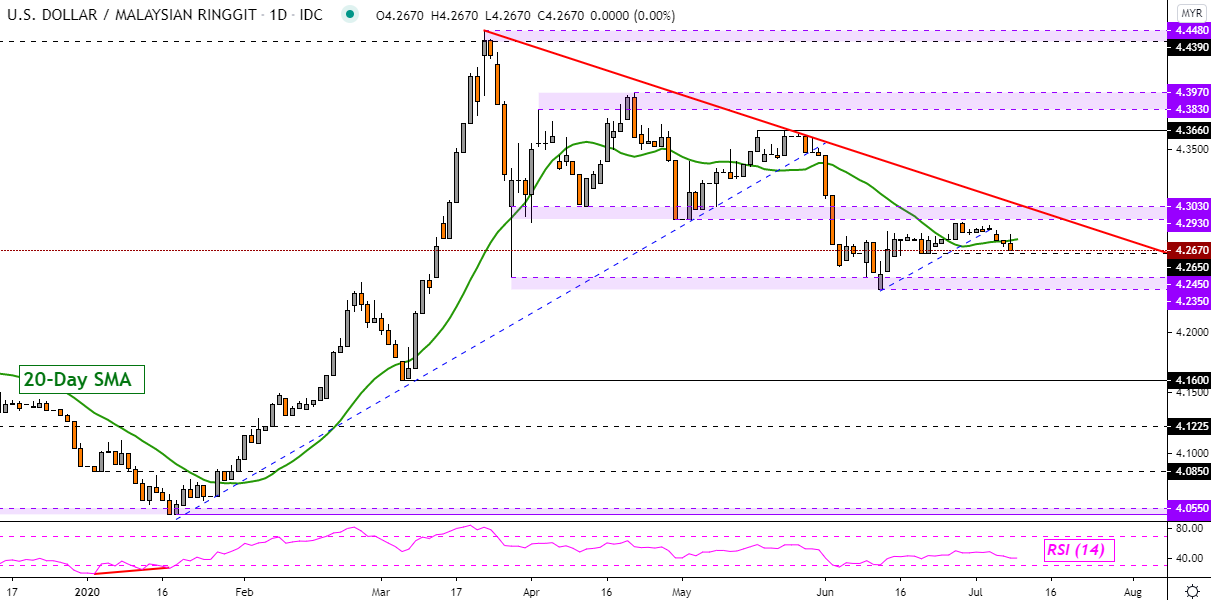
USD/MYR Chart Created in TradingView
Singapore Dollar Technical Outlook
The Singapore Dollar continues to consolidate around the 20-day SMA against the US Dollar. Thus far, prices have remained wedged between support (1.3872) and resistance (1.3993). Yet, the longer the pair ranges, the closer the falling trend line from March approaches. This resistance could reinstate the dominant downward trajectory, perhaps opening the door to testing 1.3872 on the way towards June lows (1.3760 – 1.3805). A push above the trend line exposes the 1.4070 – 1.4113 inflection range.

USD/SGD Daily Chart
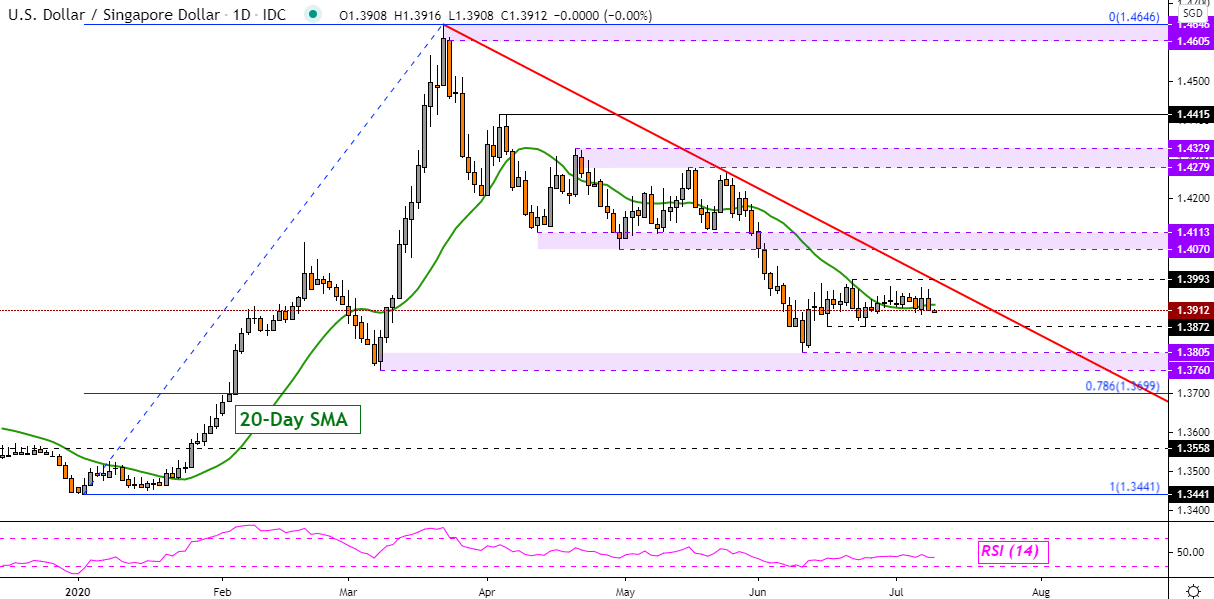
USD/SGD Chart Created in TradingView
--- Written by Daniel Dubrovsky, Currency Analyst for DailyFX.com
To contact Daniel, use the comments section below or @ddubrovskyFX on Twitter


