


Copper Technical outlook
- Bulls ease up and yet remain in charge
- Copper price chart exposes a continuation pattern
Copper Price –Decelerating Bullish Momentum
On Monday, Copper declined to its lowest level in a week at $5,667. However, the price recovered all the losses then rallied and closed the weekly candlestick on Friday in the green with a 0.4% gain.
The Relative Strength Index (RSI) rose from 64 to 68 highlighting a slowing bullish momentum.
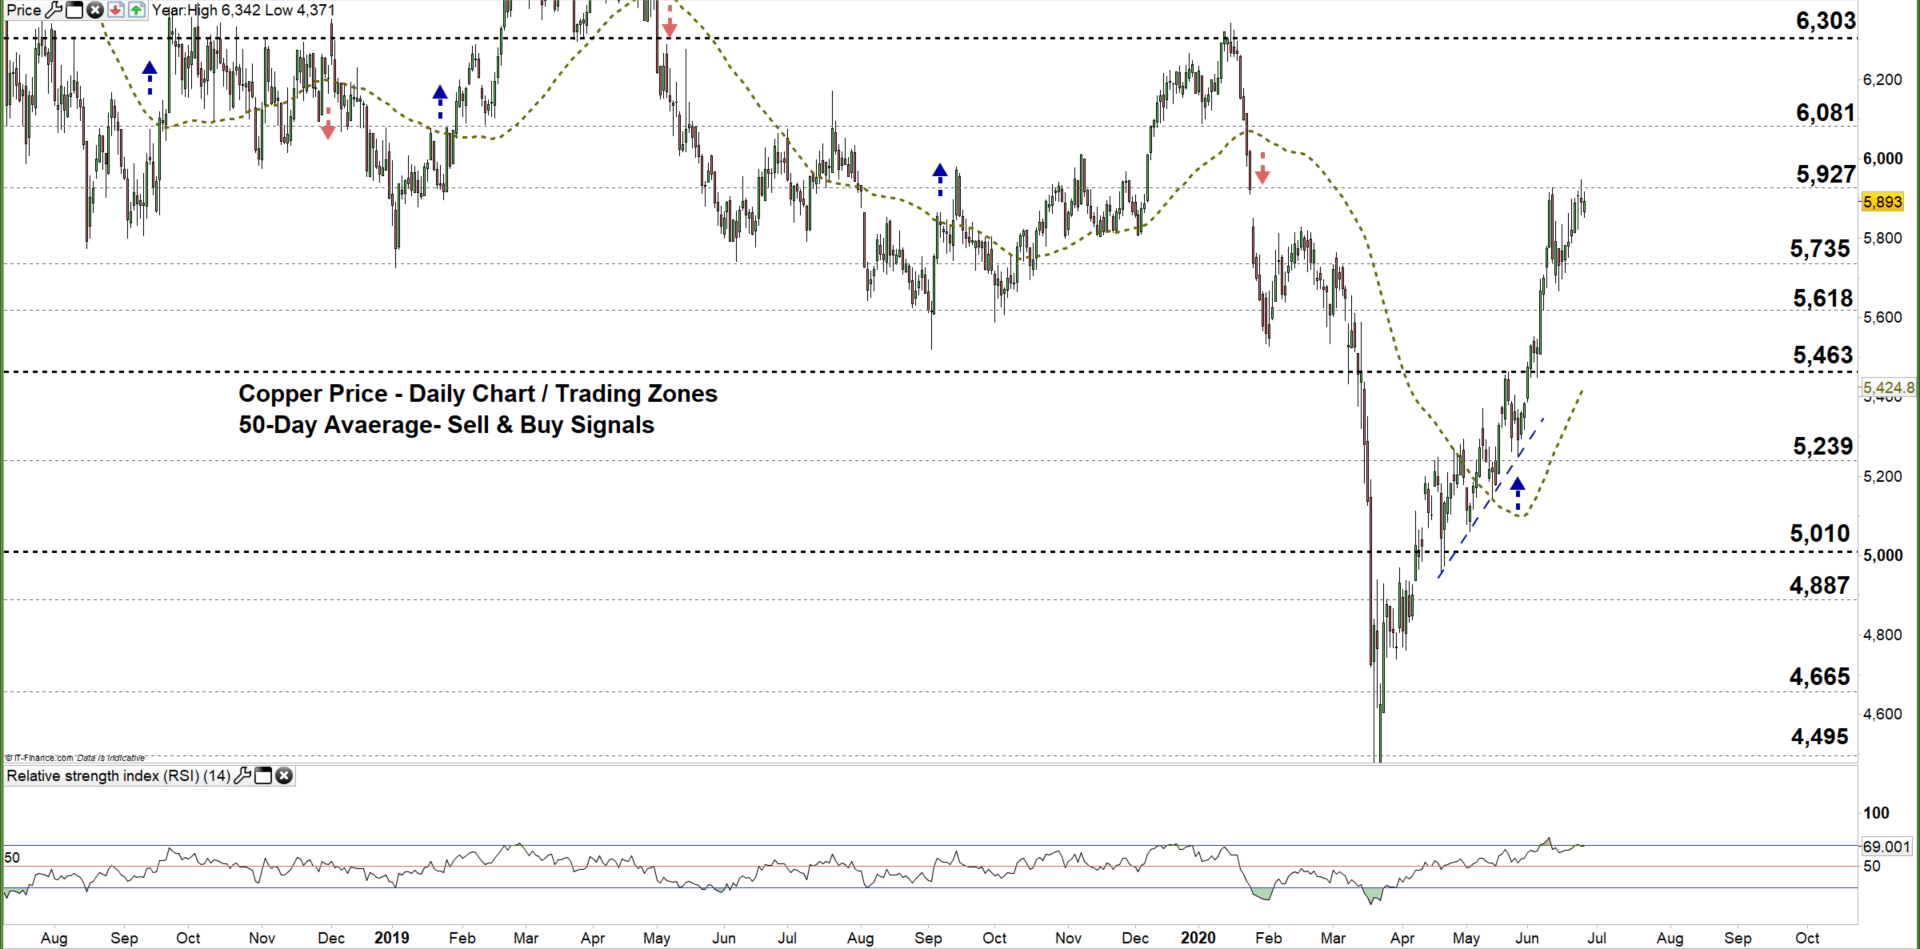
Copper DAILY PRICE CHART (JULy 17, 2018 – June 25, 2020) Zoomed out

Copper DAILY PRICE CHART (April 17 – June 25, 2020) Zoomed In

On June 11, Copper accelerated its upward trend and rallied to an over four-month high at $5,928. Nonetheless, the price retreated as some bulls seemed to cut back. A few days later, the market climbed back to the current trading zone $5,735 - $5,927 reflecting that bullish momentum remained intact.
A close above the high end of the zone signals that bulls may push towards $6,081 and any further close above that level could extend the rally towards $6,303.
On the flip-side, another failure in closing above the high end of the zone reflects the bull’s reluctance and could send the price back to the low end of the zone. Any further close below that level may cause the market to press even lower towards $5,618.

COPPER FOUR-HOUR PRICE CHART (May 1 – June 25, 2020)

This week, Copper paused its upward trend and traded in an ascending triangle. Yesterday, the market broke above the upper line of the triangle then pulled back highlighting bull’s hesitation.
Thus, a break below the lower line of the triangle invalidates the pattern and generates a bearish signal. In turn, a successful break above the upper line of the triangle generates a bullish signal.
To conclude, a break below $5,812 could send Copper towards $5,747 on the other hand, any break above $5,963 may cause a rally towards $6,012. That said, the weekly support and resistance levels marked on the chart should be watched closely.
Written By: Mahmoud Alkudsi,Market analyst
Please feel free to contact me on Twitter: @Malkudsi


