


Dow Jones, AUD/USD, NZD/USD, Trader Positioning - Talking Points
- Dow Jones Industrial Average may be at risk to turning lower next
- AUD/USD and NZD/USD may follow lower based on buy/sell bets
- Find your trading personality, optimal forms of analyzing markets
In this week’s session on IG Client Sentiment (IGCS), I covered the outlook for the Dow Jones, S&P 500, crude oil, AUD/USD and NZD/USD. In addition to technical analysis, fundamentals were also discussed. For further details and synopsis of retail positioning, check out the recording of the webinar above.
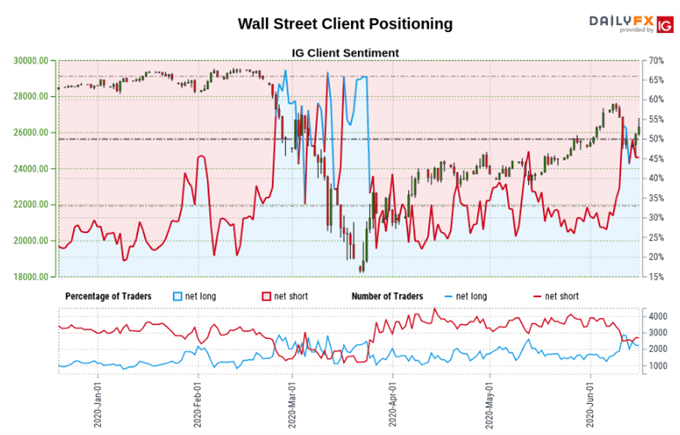
Dow Jones Sentiment Outlook - Bearish
The IG Client Sentiment (IGCS) gauge implies that 46.56% of retail traders are net long the Dow Jones, up from 35.86% last week. Since then, prices have declined over 5 percent. The number of traders net short are 6.52% and 21.08% lower from yesterday and last week respectively. Recent changes in sentiment warn that the current trend may soon turn lower despite the fact traders remain netshort.
What are some unique aspects of trading currencies?
Dow Jones Technical Analysis
Dow Jones futures seem to be struggling to find follow-through after prices broke below near term rising support from the middle of May. The index bounced off the 24507 – 24792 inflection area, setting course to perhaps retest early June highs (27312 – 27624). Downtrend resumption entails closing under the former, exposing 22704. Otherwise a push above the latter opens the door to facing 28084 – 28197.

Dow Jones Futures - Daily Chart

Dow Jones Chart Created in Trading View
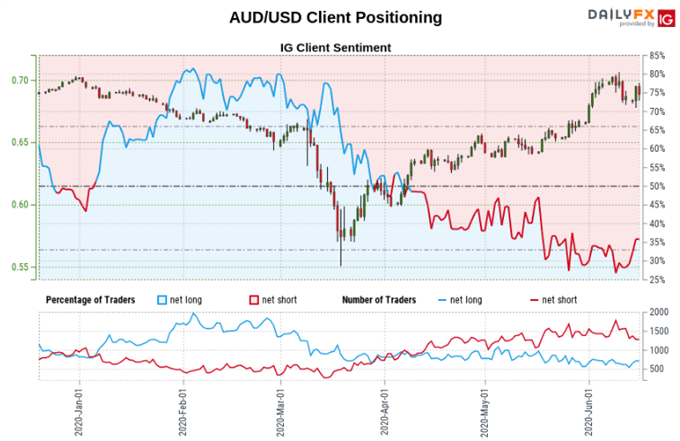
Australian Dollar Sentiment Outlook - Bearish
The IGCS gauge implies that 33.56% of retail traders are net long AUD/USD. The number of those exposed to the downside have declined by 14.22% and 22.41% from the past 24 hours and last week respectively. Recent changes in sentiment warn that the current Aussie price trend may soon turn lower despite the fact traders remain netshort. Psychologically, that may speak to a greater share of investors attempting to pick the next bottom.
Develop the discipline and objectivity you need to improve your approach to trading consistently
Australian Dollar Technical Analysis
AUD/USD is pressuring key rising support from the March bottom – red lines on the daily chart below. This follows a prior attempt which left behind a lower shadow at 0.6777. Taking out the trend lines as well as the latter may be the confirmation needed to argue that a reversal is at hand. Otherwise, adhering to the slope of appreciation may pave the way for a retest of key resistance at 0.7032.
AUD/USD – Daily Chart

AUD/USD Chart Created in Trading View
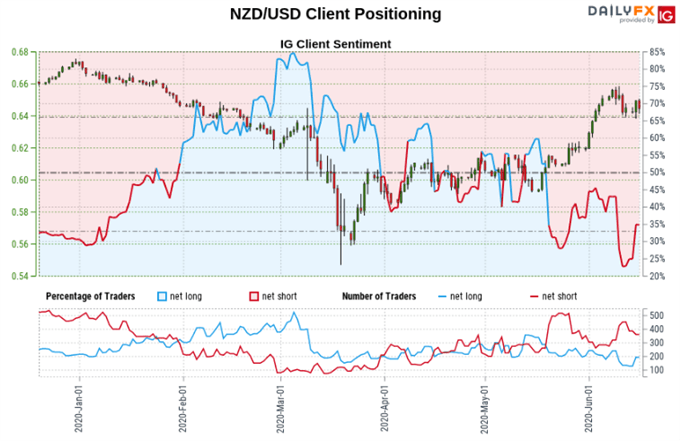
New Zealand Dollar Sentiment Outlook - Bearish
The IGCS gauge implies that 32.26% of retail traders are net long NZD/USD. Those short are 20.31% and 8.46% lower from yesterday and the previous week respectively. We typically take a contrarian view to crowd sentiment, and the fact traders are netshort suggests prices may continue to rise. Recent changes in sentiment warn that the current Kiwi Dollar price trend may soon turn lower despite the fact traders remain netshort.
New Zealand Dollar Technical Analysis
NZD/USD may be at risk to turning lower after prices pressure rising support from May – blue line on the daily chart below. Over the past 24 hours, the pairs rejected a push above this trend line, placing the focus on immediate support (0.6381 – 0.6419). A breakout under the latter may open the door to a turn lower. Otherwise, a bounce off support may place the focus on resistance at early June highs (0.6551 – 0.6585).
NZD/USD Daily Chart

NZD/USD Chart Created in Trading View
*IG Client Sentiment Charts and Positioning Data Used from June 17 Report
--- Written by Daniel Dubrovsky, Currency Analyst for DailyFX.com
To contact Daniel, use the comments section below or @ddubrovskyFX on Twitter


