


Natural Gas Technical Forecast
- Bears ease up-selling pressure
- Will bulls take charge?
Natural Gas Price – Indecisive Traders
On Friday, natural gas declined to a two-week low at $1.772 then rallied after and closed the weekly candlestick with a Doji pattern signaling the market’s indecision at this stage.
Alongside that, the Relative Strength Index (RSI) remained flat below 50 highlighting a paused bearish momentum.
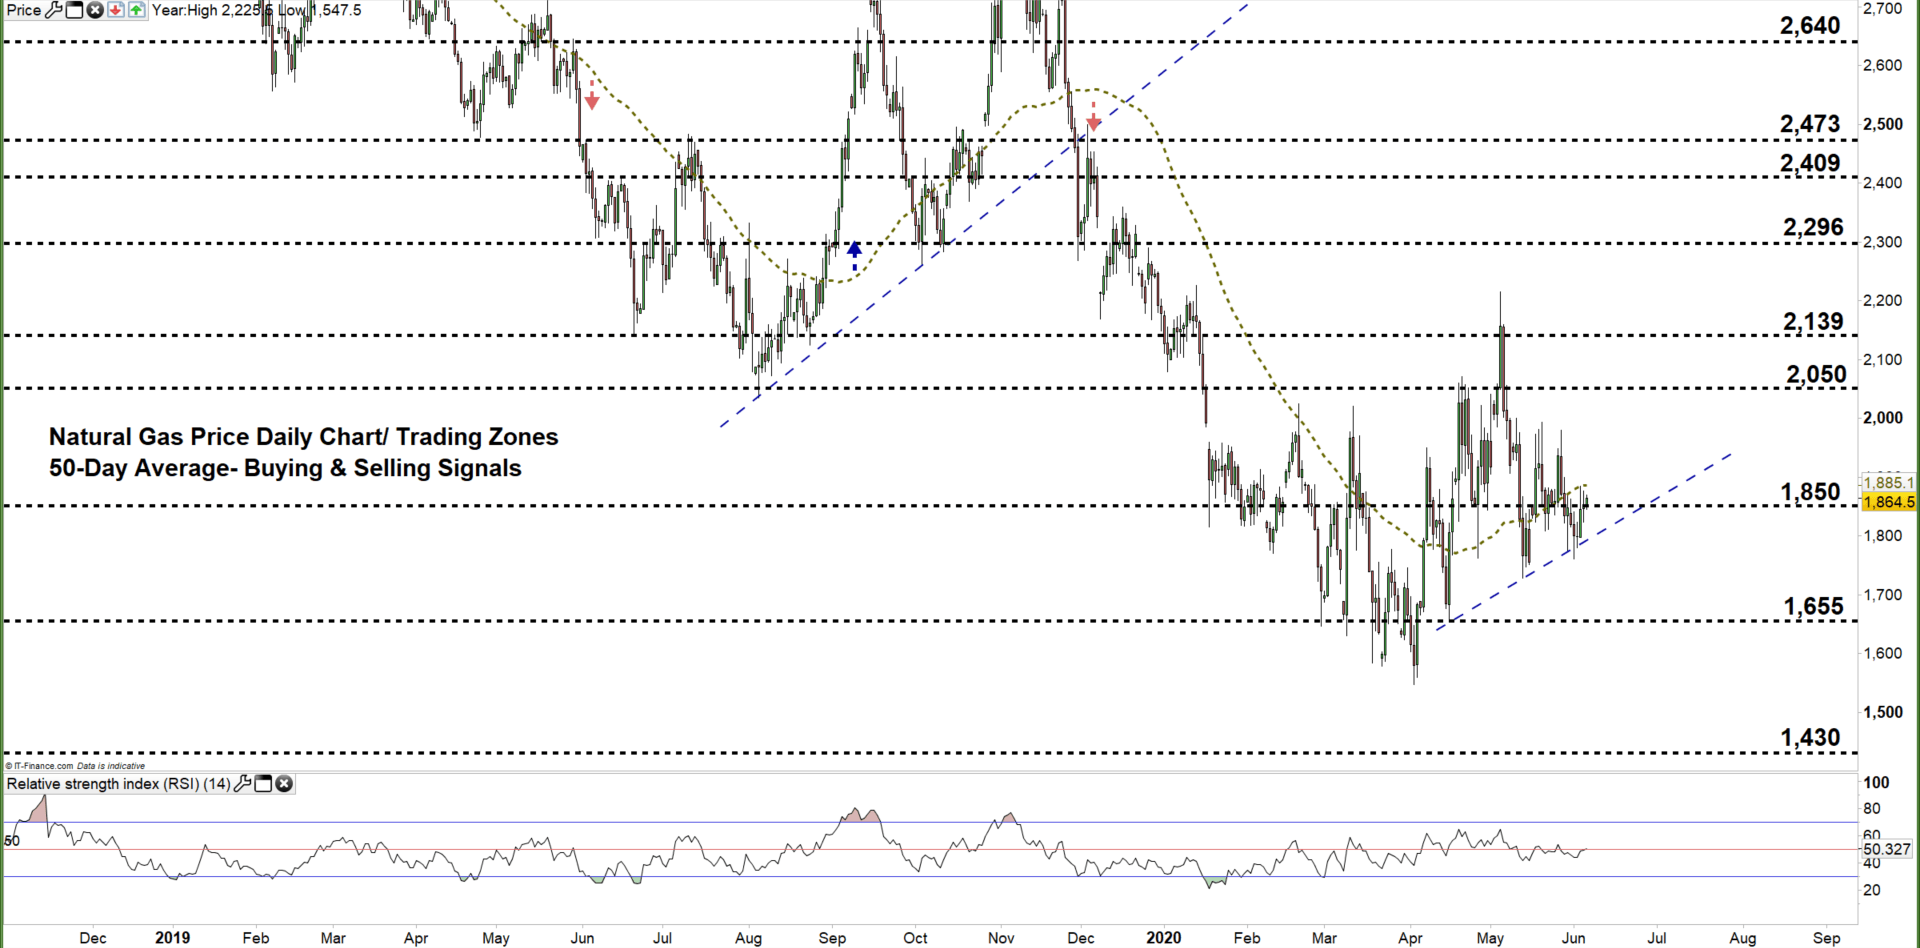
Nat-Gas DAILY Price CHART (Nov 2, 2018 – June 5, 2020) Zoomed Out

Natural Gas DAILY Price CHART (March 10 – June 5, 2020) Zoomed IN

On May 29, the price rebounded from the uptrend line originated from the April 16 low at $1,653. This week, Natural gas remained trading above the aforementioned line reflecting bear’s hesitation. Yesterday, the market climbed to the current trading zone $1,850 - $2,050 yet closed below the 50-day moving average.
Another close above the low end of the trading zone may encourage bulls to push towards the high end of it. A further close above this level may extend the rally towards $2,139.
On the flip-side, any close below the low end of the zone signals a possible fall towards $1,655. A further close below that level could send the market even lower towards $1,430.
That said, the daily and weekly support and resistance levels marked on the daily chart should be kept in focus.

Natural Gas price Four-Hour PRICE CHART (May 25 – June 5, 2020)
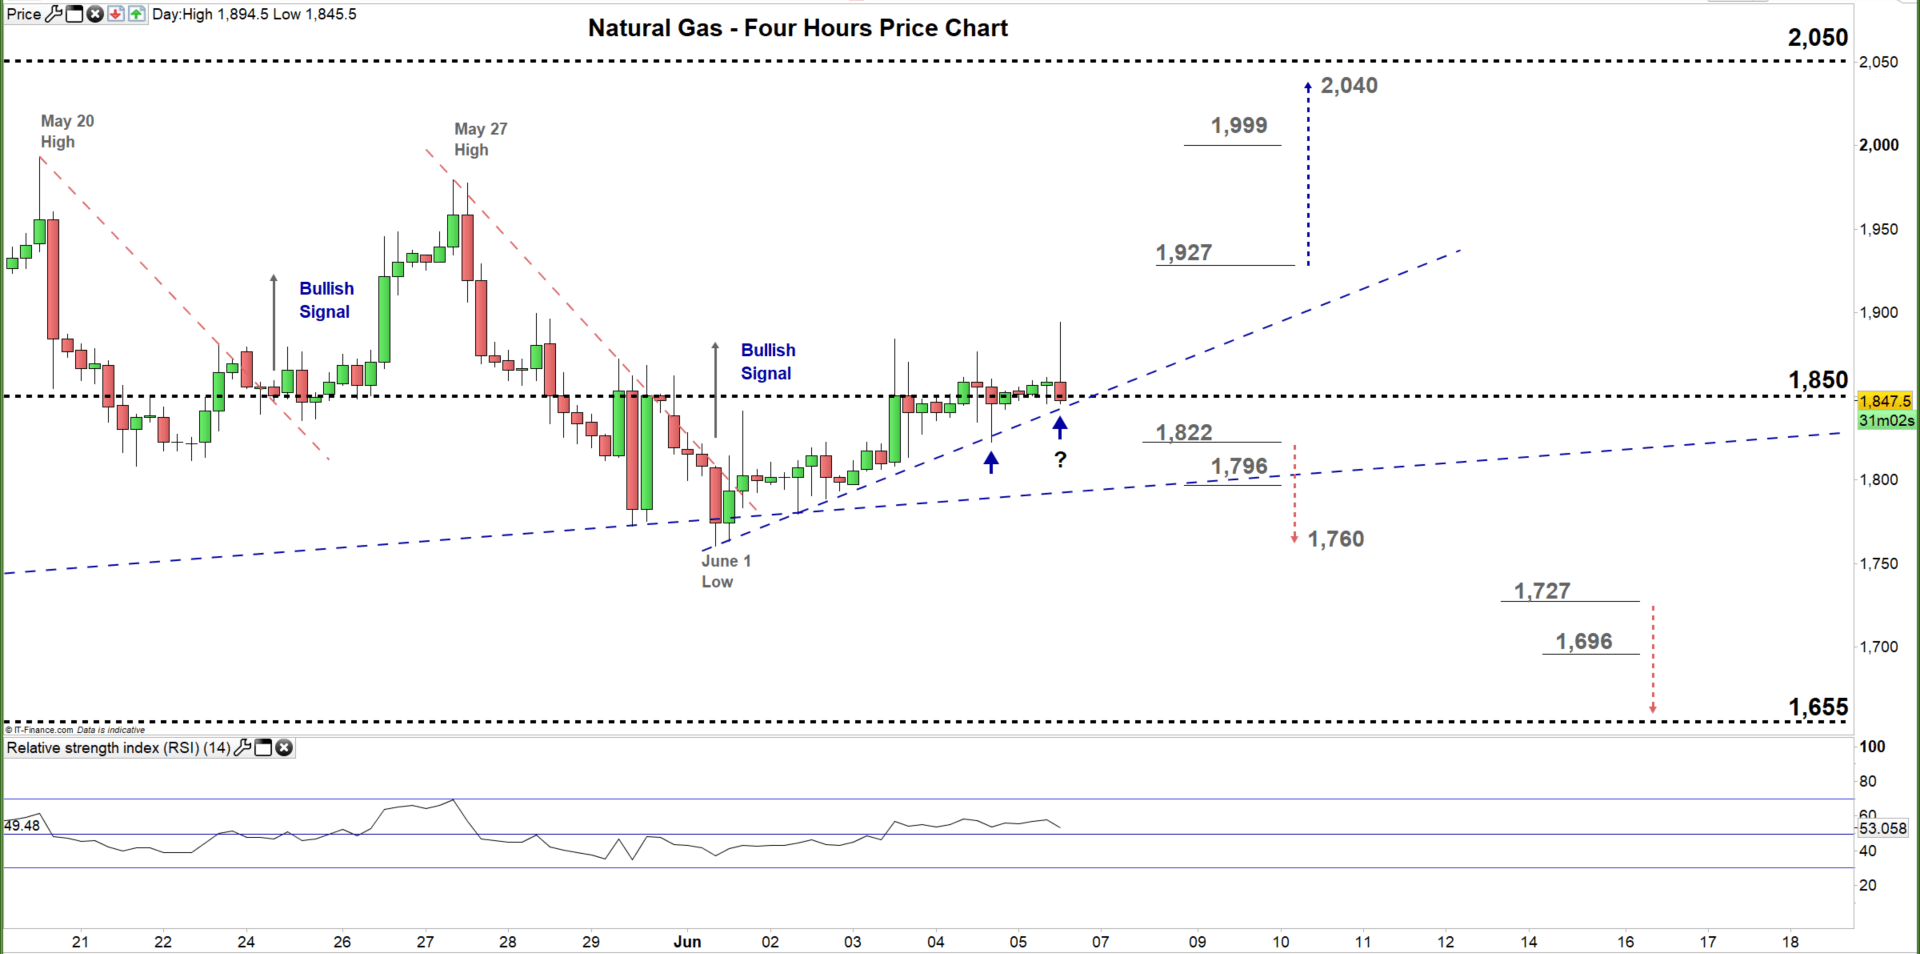
On Monday, the price rallied above the downtrend line originated from the May 27 high at $1,979 and generated a bullish signal. Yesterday, the price respected the uptrend line originated from the June 1 low at $1,760 and provided another bullish signal.
Thus, a break above $1,927 could trigger a rally towards $2,040 in turn, a break in the other direction i.e. below $1,822 may send natural gas back towards the June 1 low mentioned above. Nonetheless, the daily support and resistance underlined on the four-hour chart should be watched closely.
Written By: Mahmoud Alkudsi, Market Analyst
Please feel free to contact me on Twitter: @Malkudsi


