


BTC/USD Price Technical Outlook
- Bitcoin price chart reveals a reversal pattern
- Will bulls give up control?
BTC/USD – Bulls Pullback
On May 8, Bitcoin surged to a two and a half month-high at $10,071. However, the price fell after, indicating that the uptrend was losing steam. Last week, bulls eased up even more and caused a further decline. Consequently, the market closed the weekly candlestick in the red with a 7.7% loss.
This week, the Relative Strength Index (RSI) has fallen from 63 to 51 highlighting a weaker bullish momentum.
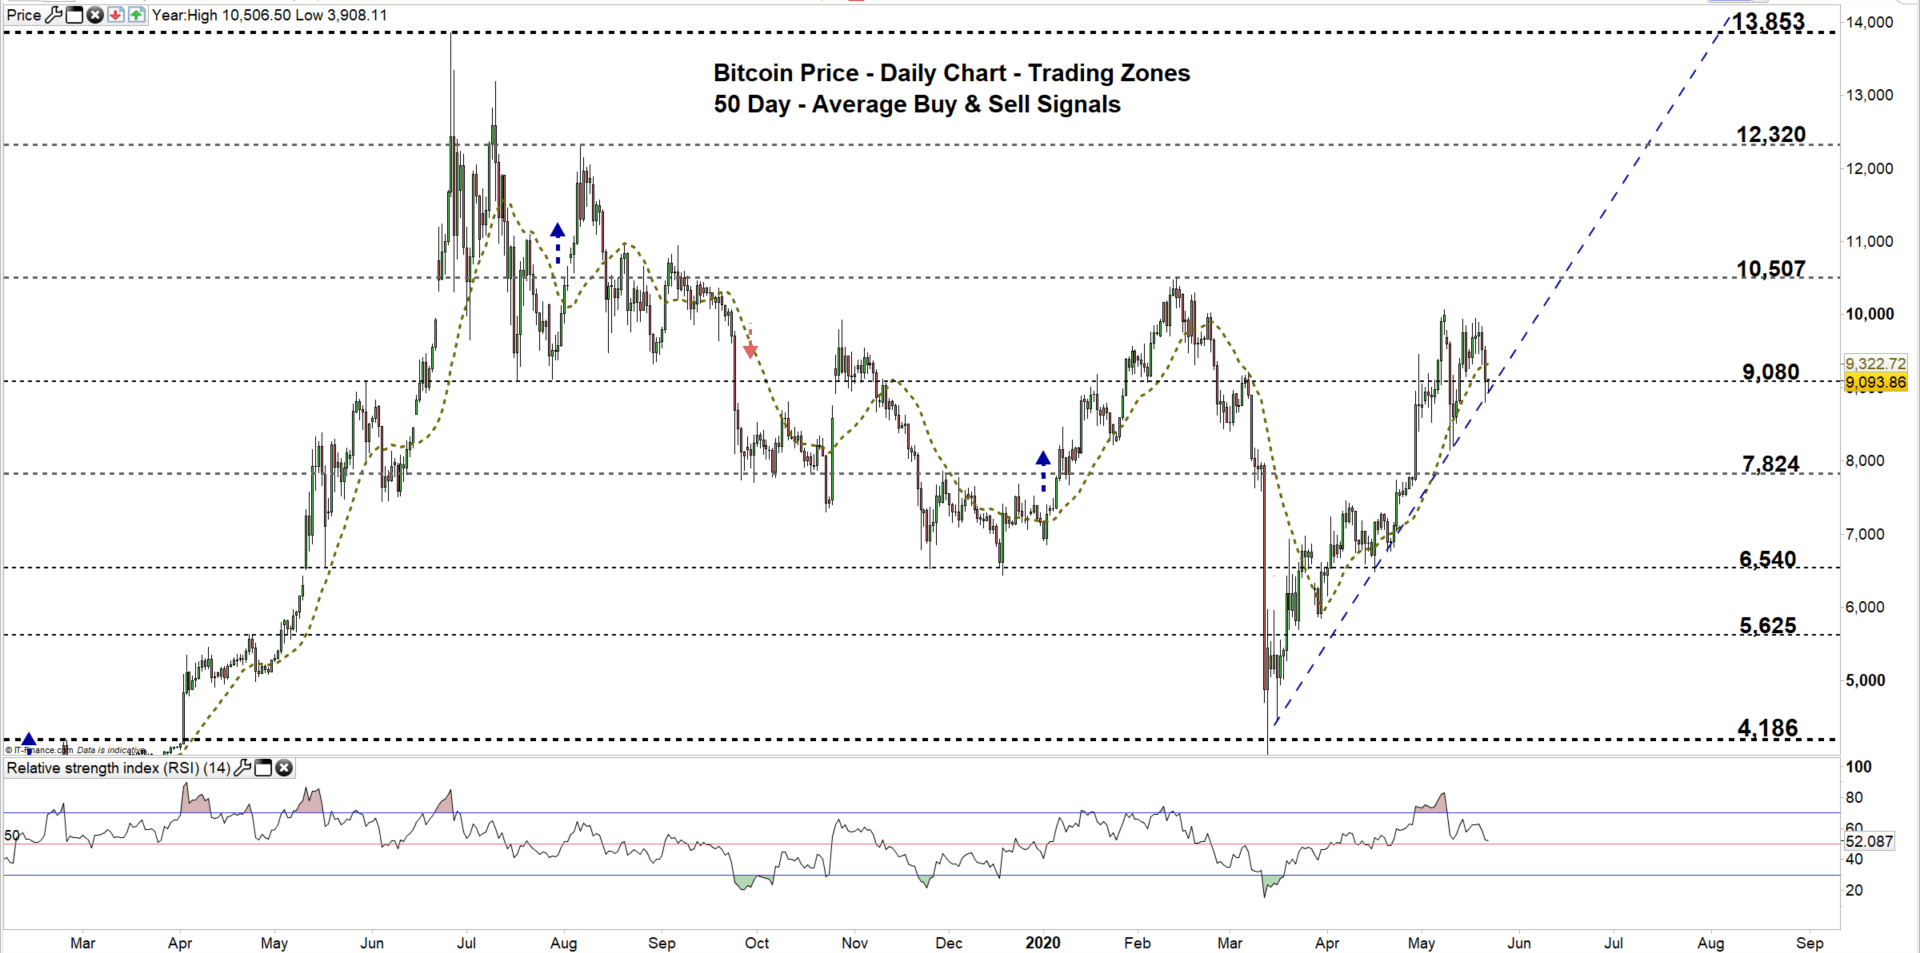
Bitcoin PRICE DAILY CHART (MaR 15, 2019 – May 22, 2020) Zoomed Out

Bitcoin PRICE DAILY CHART (March 17 – May 22, 2020) Zoomed In
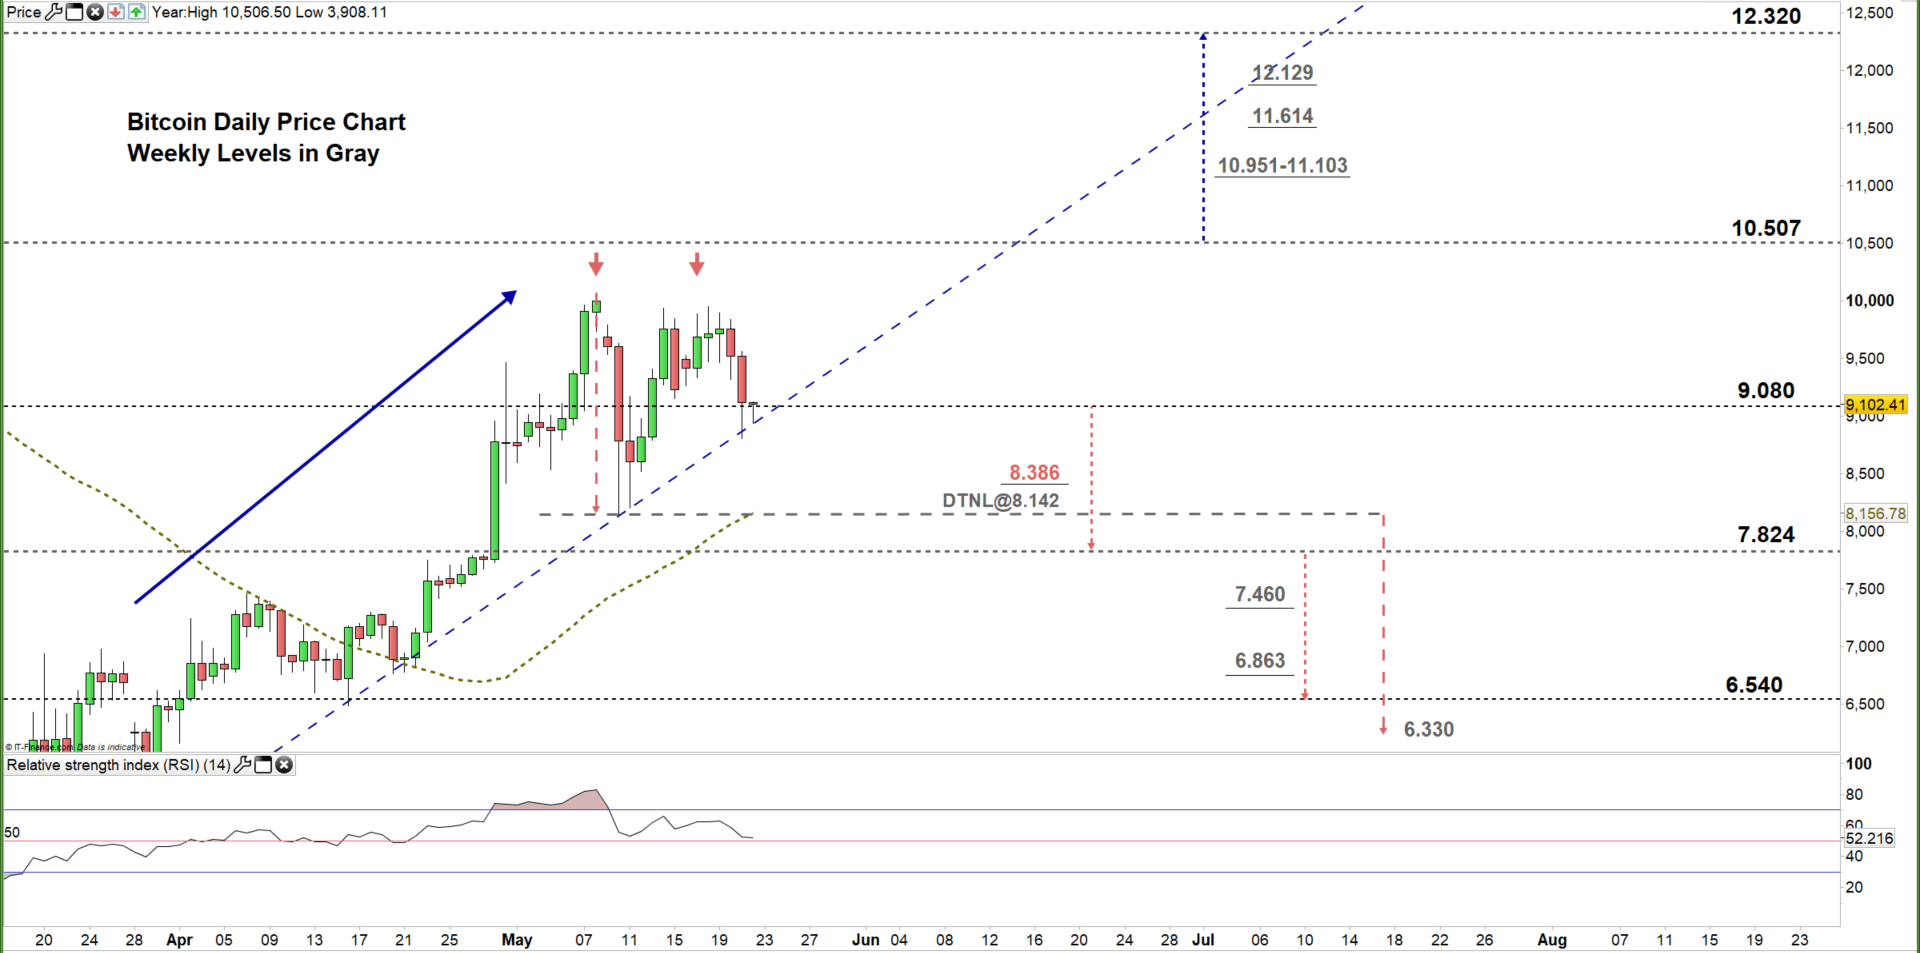
Based on the daily chart analysis, this week the price has rallied then reversed lower towards the low end of the current trading zone $9.080 - $10,507. As a result, the price developed a double top pattern where the neckline resides at $8,142. Therefore, any violation of this level would be considered a bearish signal.
A close below the low end of the aforementioned trading zone could end the bullish momentum and possibly encourage bears to press towards $7,824. In that scenario, the daily support level with the neckline of the double top pattern marked on the chart (zoomed in) should be watched closely.
On the other hand, any failure in closing below the low end of the zone means that the bullish momentum is still intact, and may lead bulls to reattempt testing the high end of the zone. A further close above that level could extend the rally towards $12,320. Having said that, the weekly resistance levels and area underscored on the chart should be considered.

Bitcoin PRICE FOUR Hour CHART (May 10 – May 22, 2020)
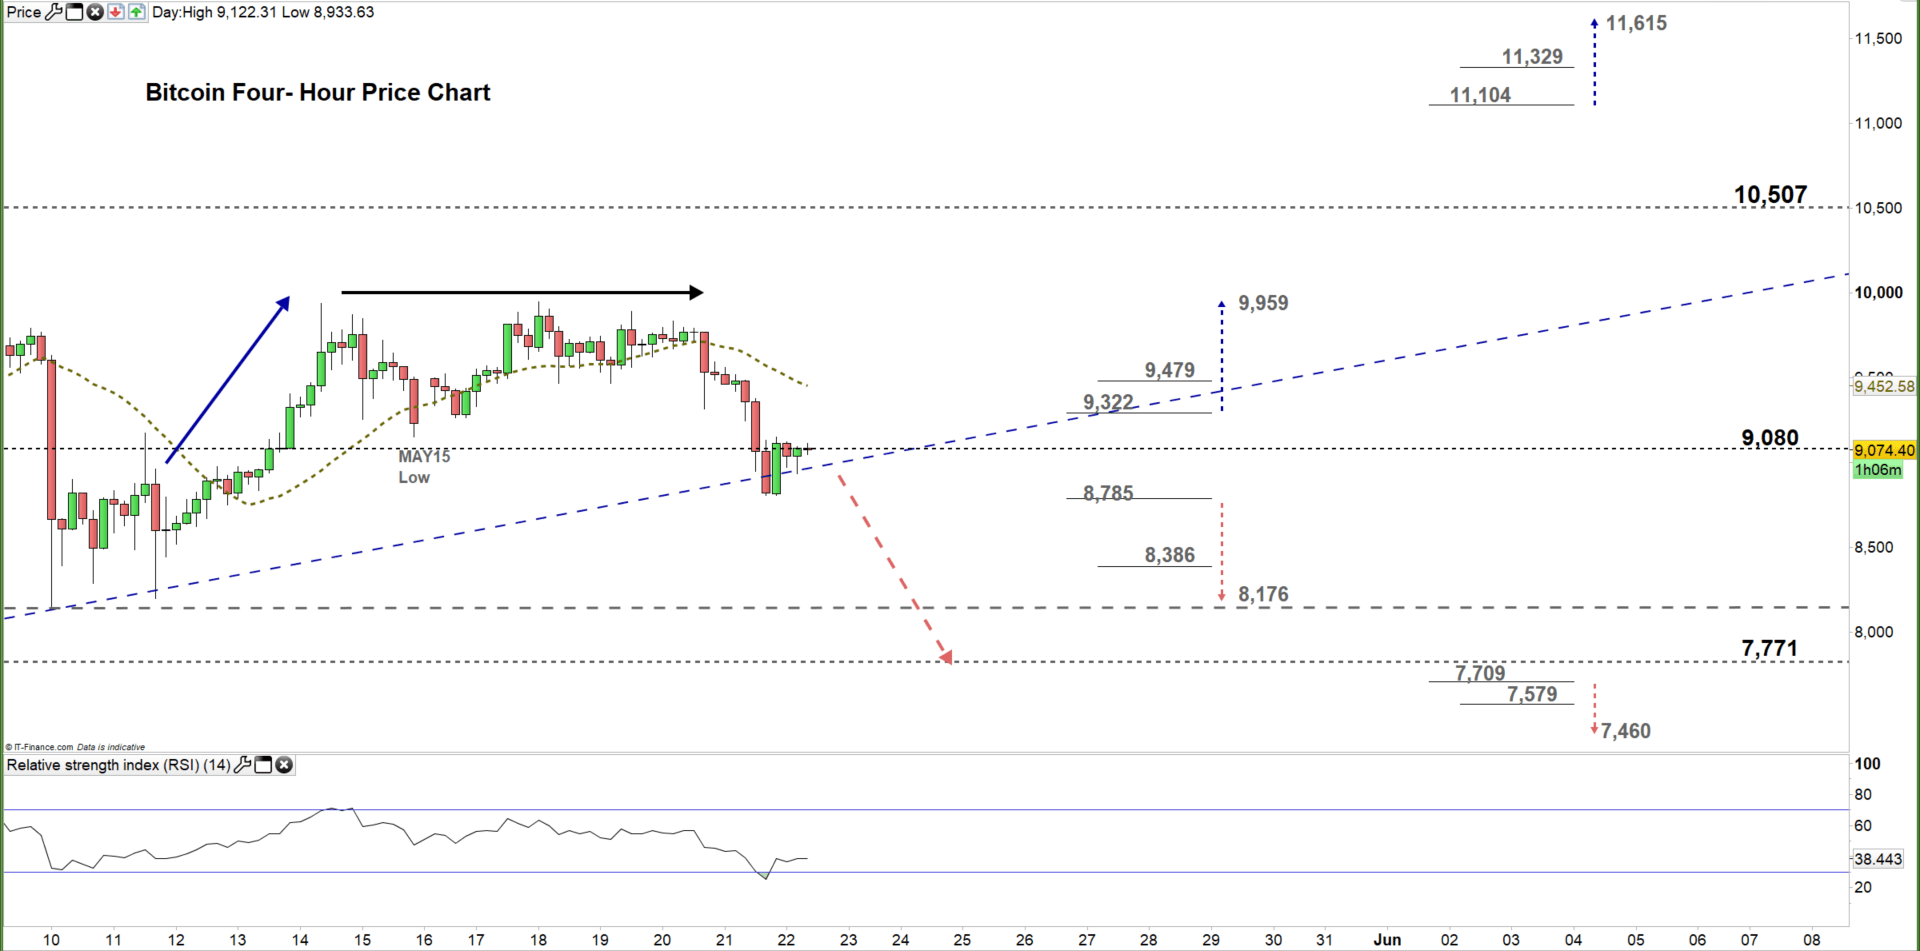
Looking at the four-hour chart, in mid-May Bitcoin started a sideways move creating lower highs with higher lows. However, the price broke below the May 15 low at $9,149 and generated yesterday a bearish signal.
A break below $8.785 would be considered an additional bearish signal and could send BTC/USD towards $8,176. Although, the daily support level underlined on the chart should be monitored. On the other hand, any break above $9,322 may cause a rally towards $9,959. Nonetheless, the daily resistance level printed on the chart should be kept in focus.
See the chart to know more about the critical levels in a further bearish/ bullish move.
Read More: Bitcoin Price: How Will Halving, Coronavirus After BTC?

Written By: Mahmoud Alkudsi, Market Analyst
Please feel free to contact me on Twitter: @Malkudsi


