


Copper Technical Outlook
- Bulls in charge, yet with reluctance
- Bullish signals on Copper price chart
Copper Price – Indecisive Traders
On April 21, Copper declined to a near two weeks low at $4.954. However, the price rallied then closed the weekly candlestick on Friday with a Doji pattern signaling the market’s indecision at this stage.
This week, the Relative Strength Index (RSI) has remained flat highlighting a paused uptrend move.
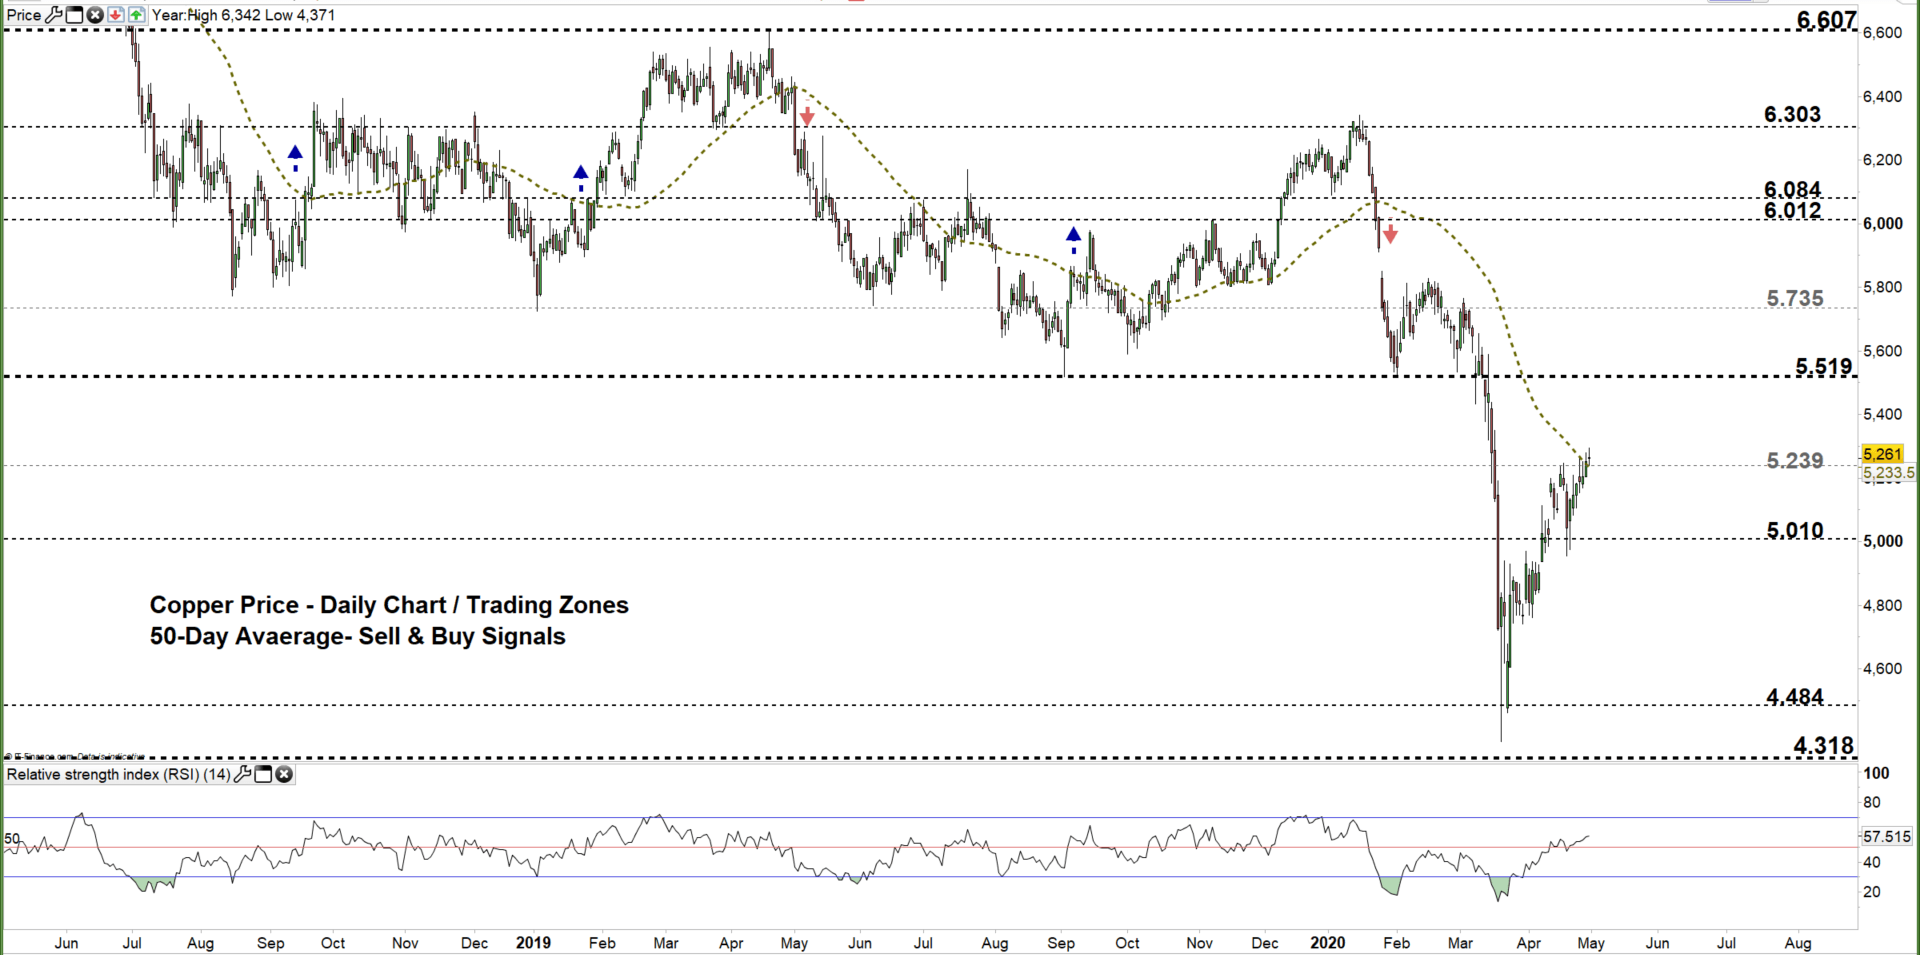
Copper DAILY PRICE CHART (May 17, 2018 – April 30 , 2020) Zoomed out

Copper DAILY PRICE CHART (FEB 19 – April 30, 2020) Zoomed In
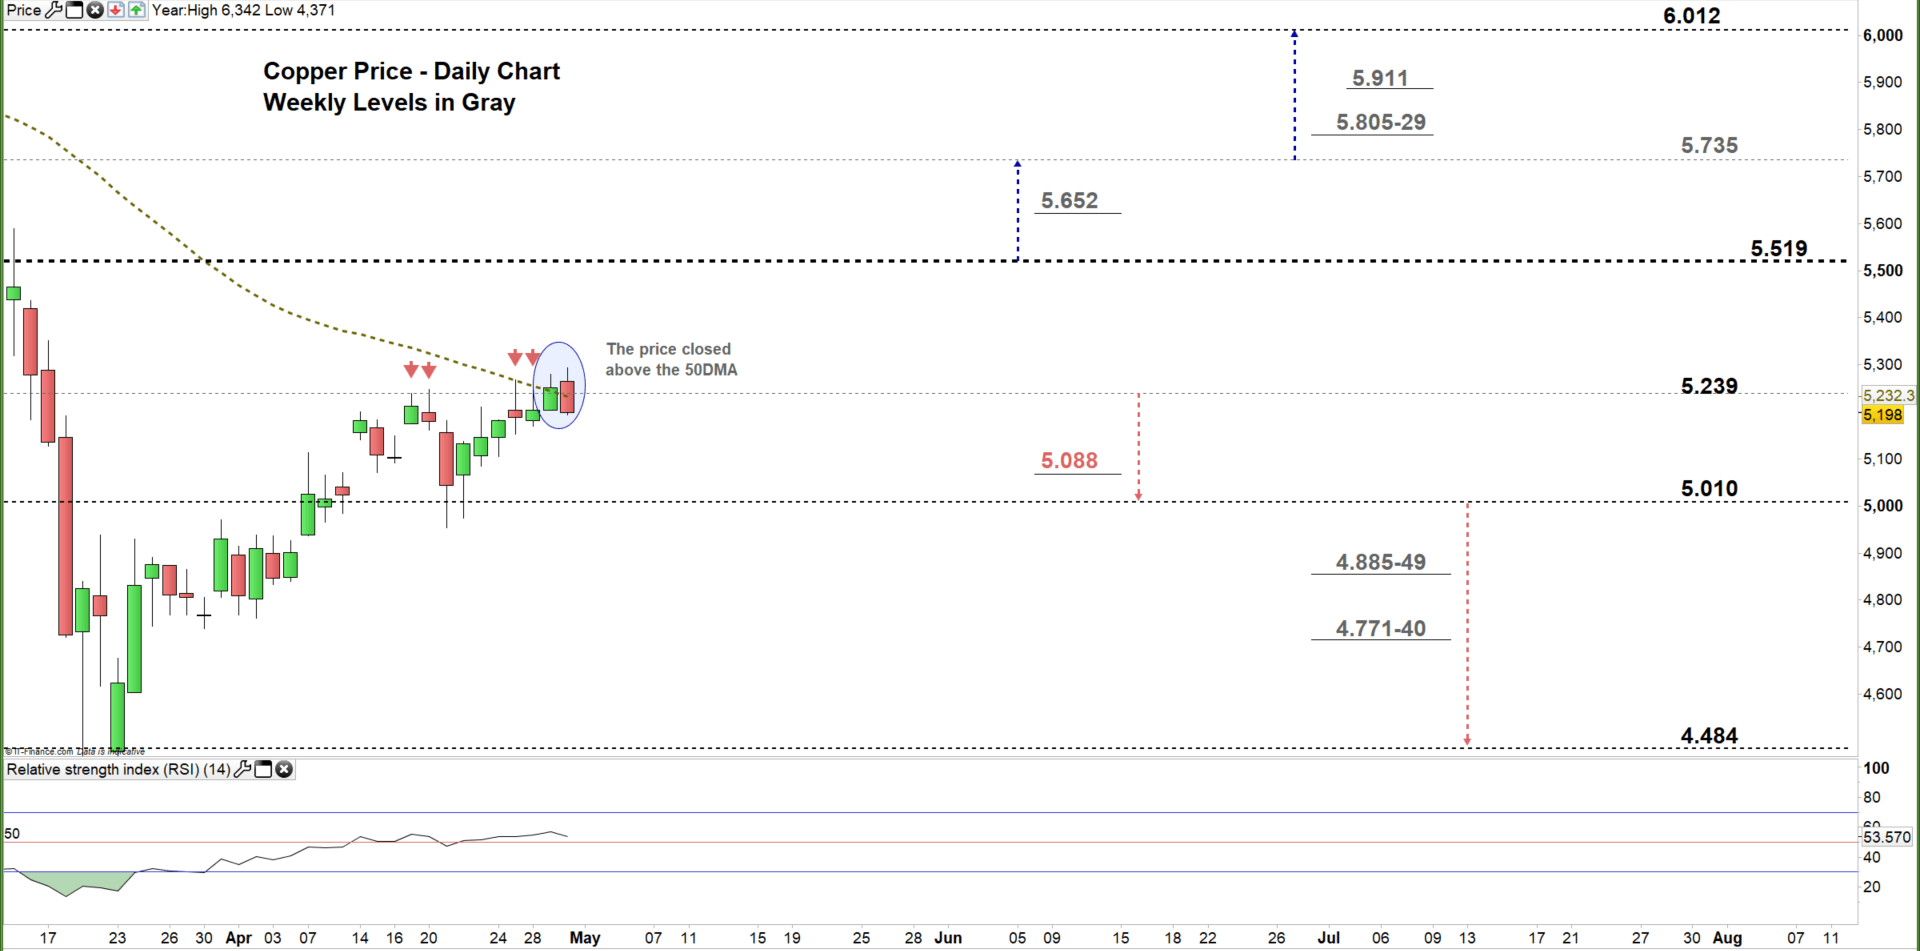
Looking at the daily chart, I notice that since April 17 the price has failed on multiple occasions to rally to the higher trading zone, signaling bull’s hesitation. Yesterday, the market closed above the 50-day moving average generating a bullish signal. Additionally, Copper climbed to the current trading zone $5.239 - $5.519.
Another close above the low end of the zone reflects a stronger bullish sentiment. This may cause a rally towards the high end of the zone. A further close above that level could extend the rally towards $5.735. Although, the weekly resistance level underlined on the chart (zoomed in) should be considered.
On the other hand, a close below the low end of the zone highlights bull’s hesitation. This could send Copper towards $5.010. A further close below that levels could send the price even lower towards $4.484. That being said, the daily and the weekly support areas should be monitored along the way.

COPPER Four-HOUR PRICE CHART (Mar 16 – April 30, 2020)
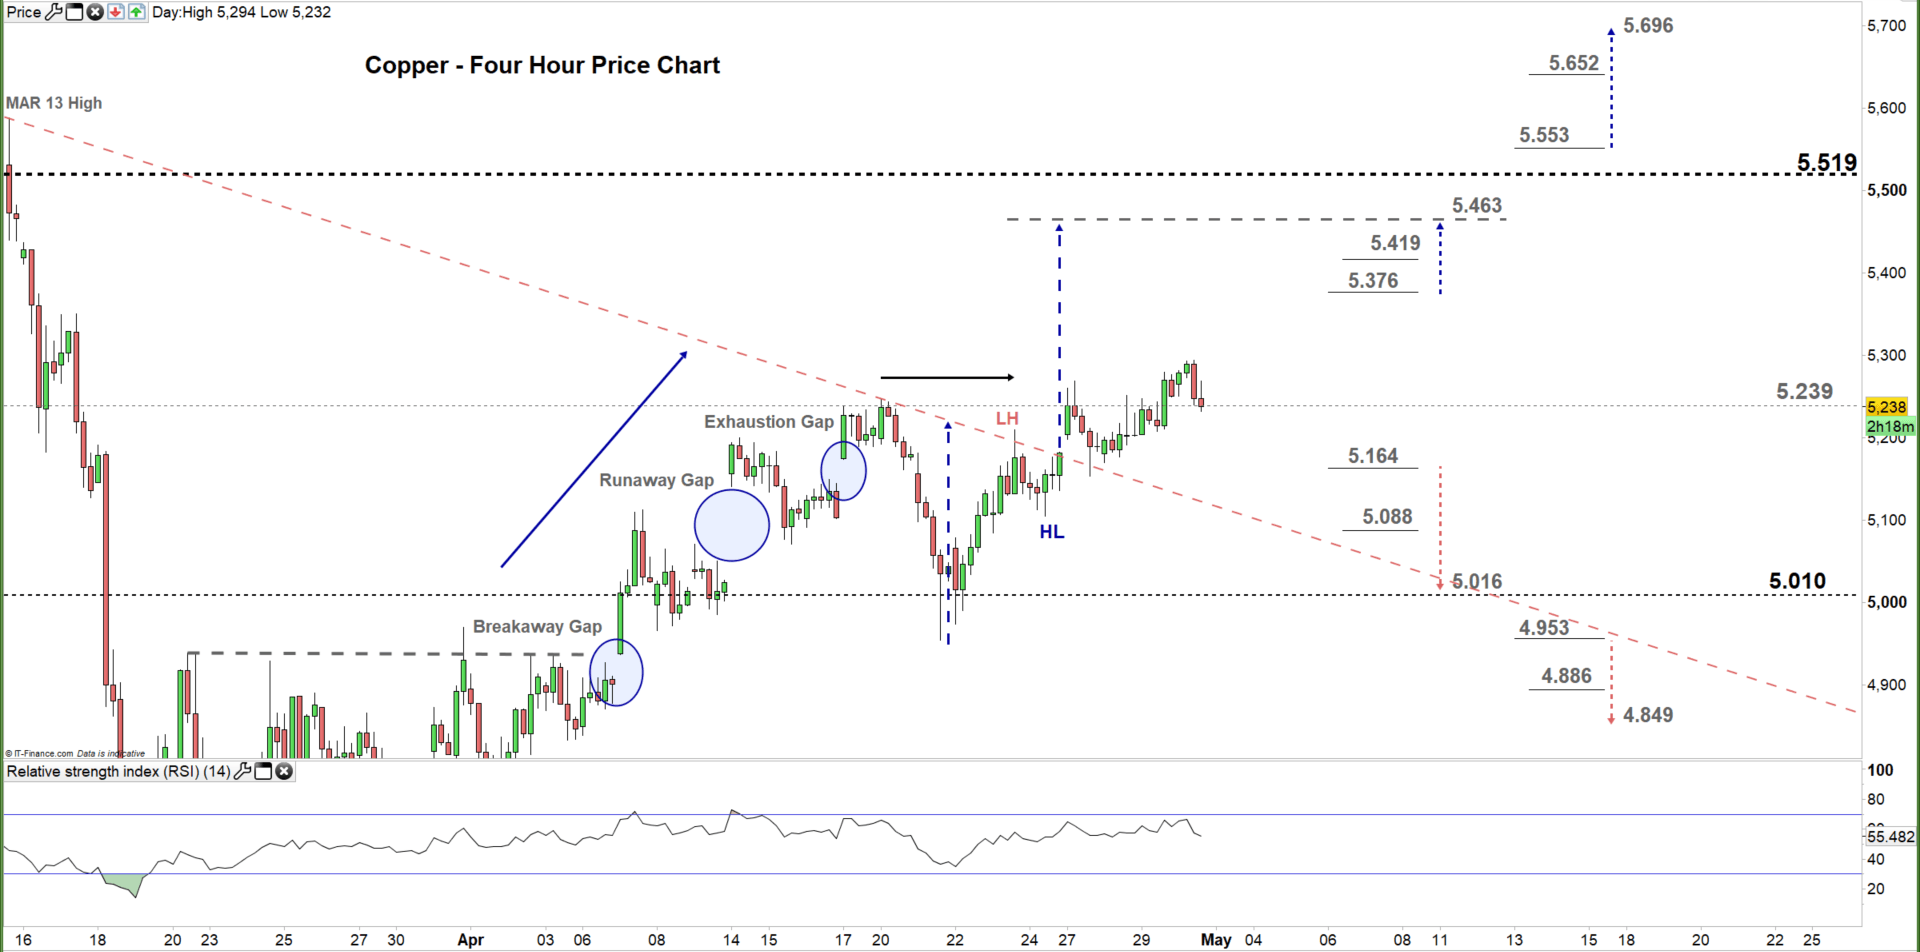
From the four-hour chart, I noticed that on April 7 Copper opened with a breakaway gap then pushed higher. Later on, the price traded in a sideways move. On Monday, the market resumed bullish price action after breaking above the downtrend line originated from the March 13 high at $5.589.
A break above $5.376 would be considered a bullish signal. This may cause a rally towards $5.463. Nevertheless, the weekly resistance level underscored on the chart should be kept in focus. In turn, a break in the other direction i.e. below $5.164 could send Copper towards $5.016. In that scenario, the daily support level printed on the chart should be watched closely.
See the chart to know more about the key technical levels in a further bullish/bearish move.
Written By: Mahmoud Alkudsi, Market Analyst
Please feel free to contact me on Twitter: @Malkudsi


