


BTC/USD Price Technical Analysis
BTC/USD – Lack of Impulse
On Thursday, Bitcoin retreated to its lowest level in two weeks at $6.485 then rallied after. In the following day, the price closed with a Doji pattern highlighting the market’s indecision at this point.
Alongside that, the Relative Strength Index (RSI) fell from 55 to 51, highlighting weaker uptrend momentum.
Bitcoin PRICE DAILY CHART (FEB 15, 2019 – April 20, 2020) Zoomed Out


Bitcoin PRICE DAILY CHART (March 15 – April 20, 2020) Zoomed In
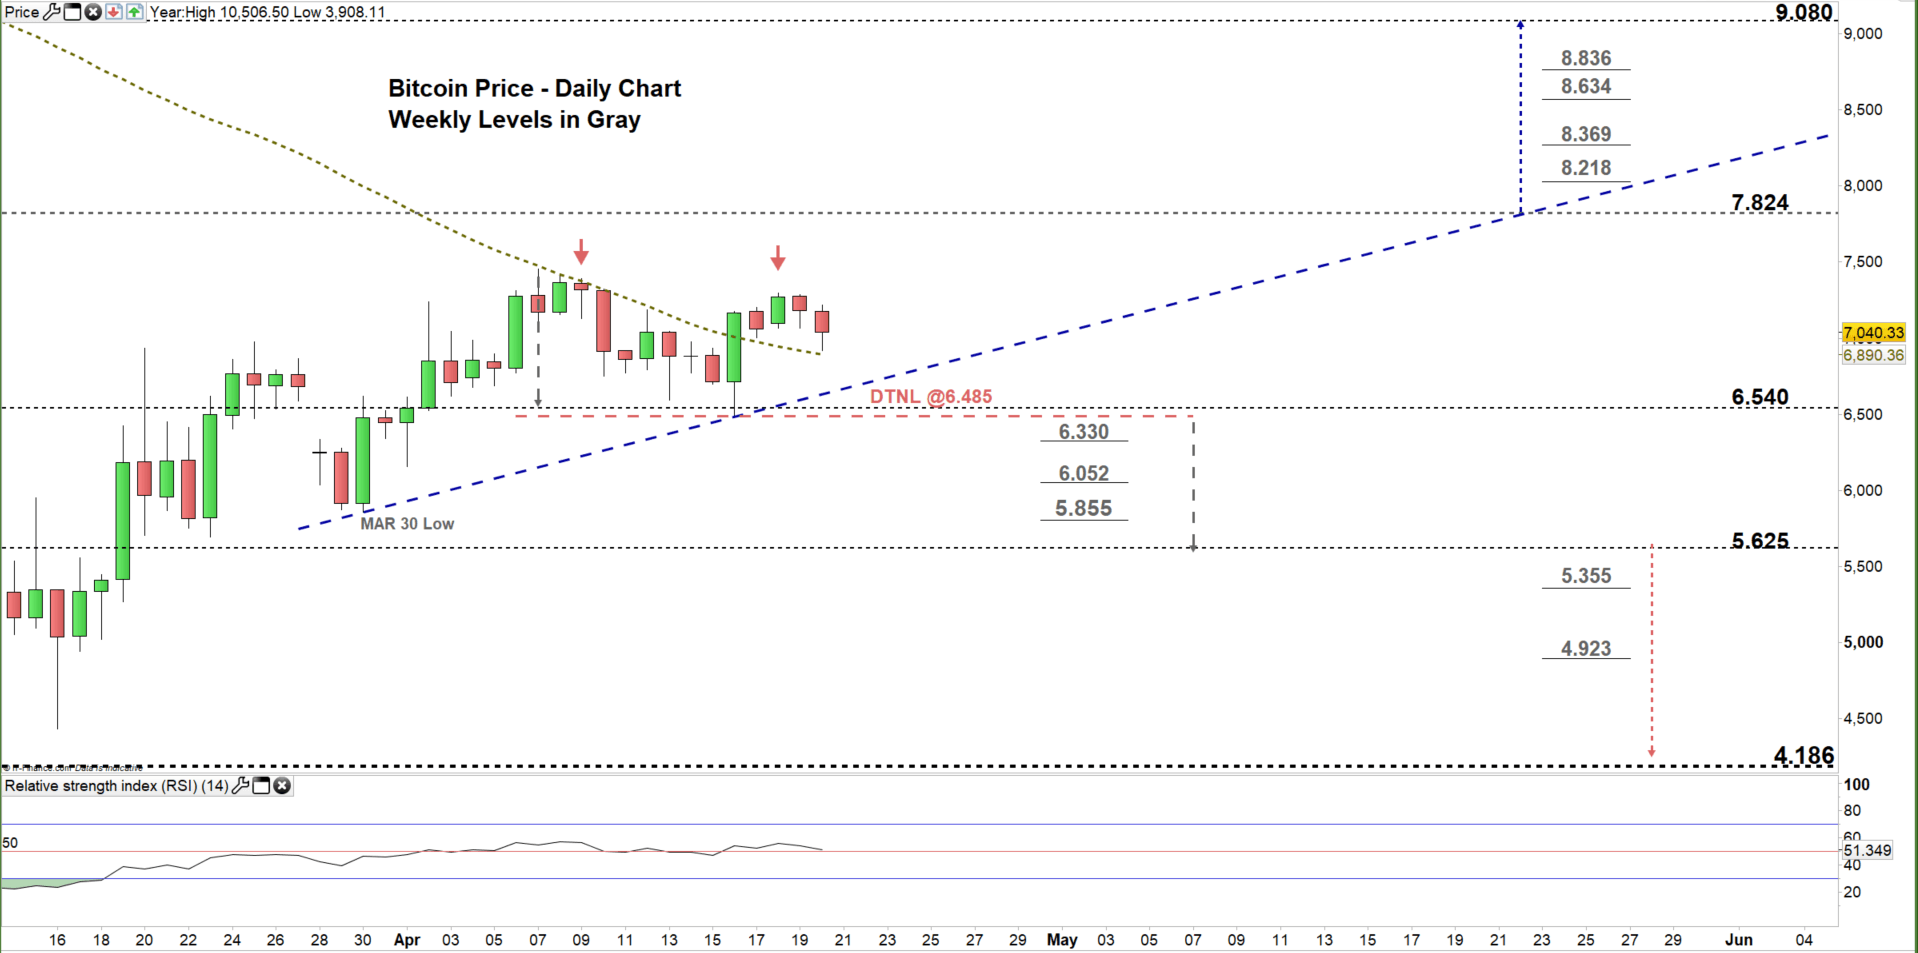
Looking at the daily chart, we noticed that on April 2 the price climbed to current trading zone $6.540- $7.824. On Saturday, the price pointed lower eyeing a test of the uptrend line originated from the March 30 low at $5.855, then the neckline of double top pattern residing at $6.485.
A close below the low end of the zone could send Bitcoin towards $5.625.Further close below that level may encourage bears to press towards $4.186. Nevertheless, the weekly support levels underlined on the chart (zoomed in) should be considered.
On the flip side, any failure in closing below the low end of the zone may reverse the price’s direction towards the high end of the zone. Further close above that level negates the aforementioned double top pattern, and may cause a rally towards $9.080.Yet, the weekly resistance levels marked on the chart should be watched closely.

Bitcoin PRICE FOUR Hour CHART (April1 – April 20, 2020)
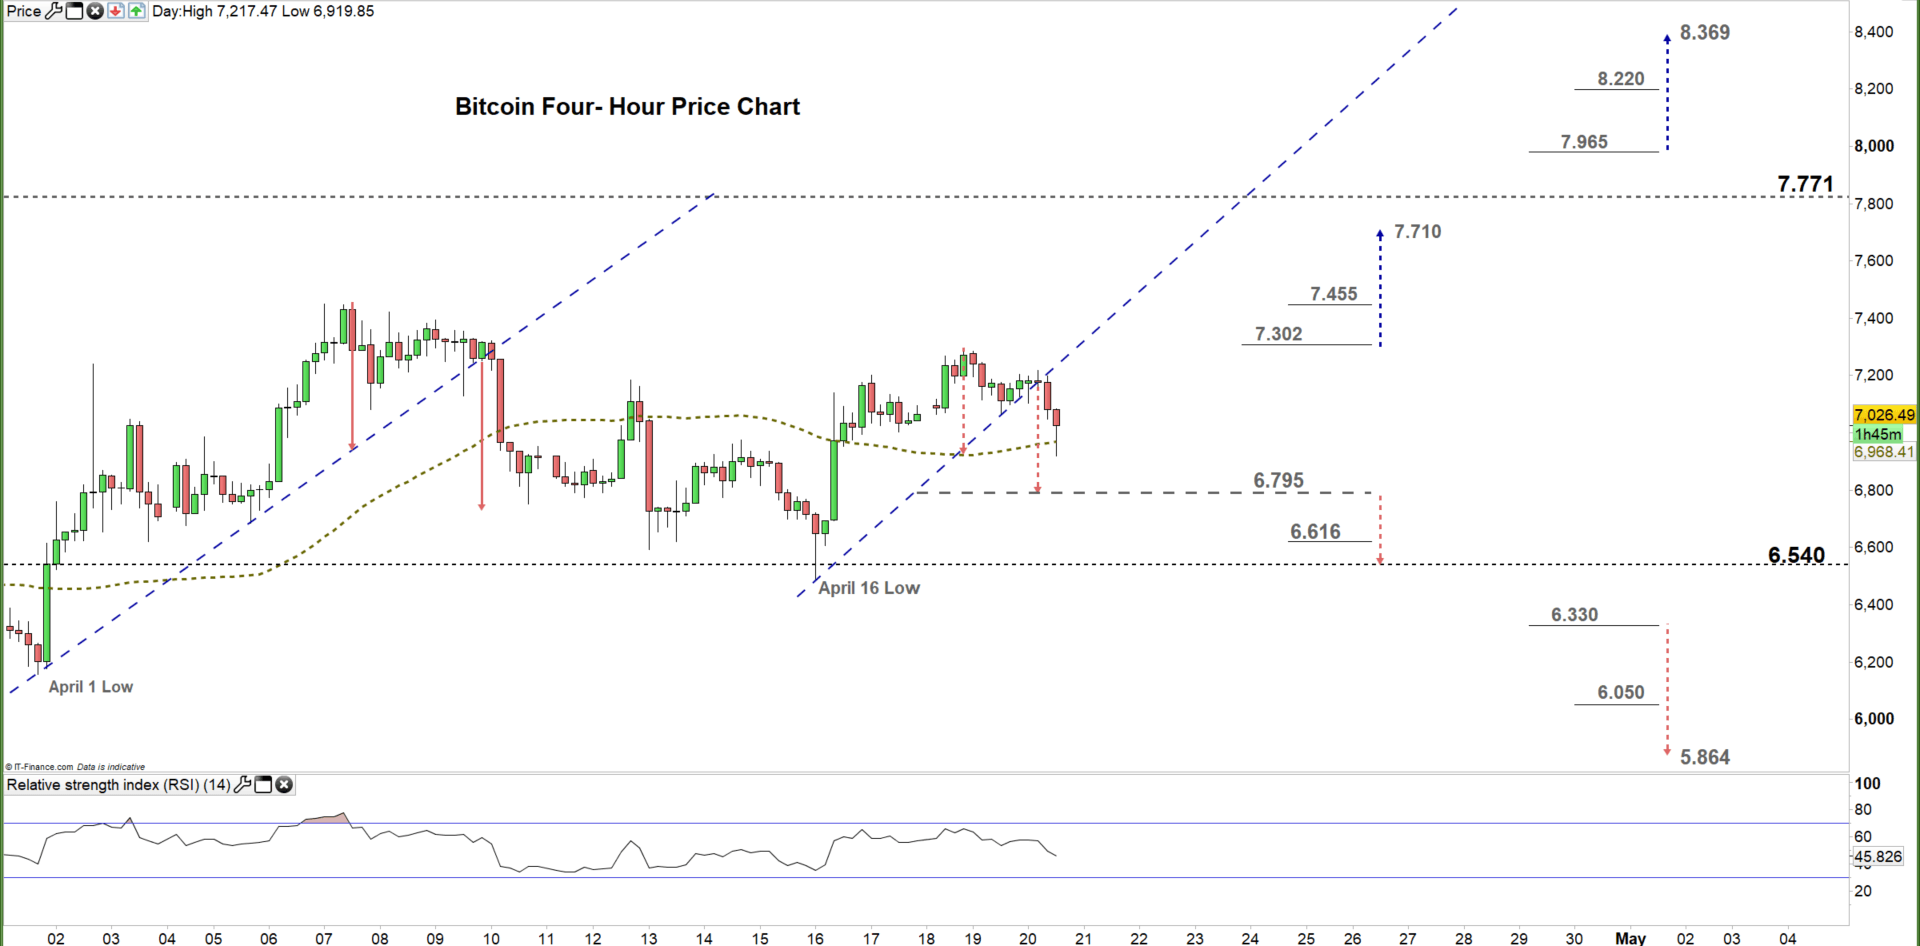
Looking at the four-hour chart, we noticed that on April 10 Bitcoin broke below the uptrend line originated from the April 1 low at $6.157.
Yesterday, the market pressed below the uptrend line originated from April 16 low eyeing a test of $6.795. A break below this level may send BTC/USD even lower towards the low end of current trading zone discussed on above on the daily chart. In that scenario, the daily support level underscored on the chart should be kept in focus.
On the other hand, any break above $7.302 may convince bulls to push towards $7.710. Having said that, the resistance level printed on the chart should be monitored.
See the chart to know more about the critical levels in a further bearish/ bullish move.

Written By: Mahmoud Alkudsi
Please feel free to contact me on Twitter: @Malkudsi


