


Copper Technical Outlook
- Bulls take charge yet with reluctance
- Exhausted uptrend move
Copper Price – Edging Higher
On Tuesday, Copper surged to $5.113 – its highest level in nearly three weeks. Later on, the market retreated and yet, the price closed the weekly candlestick in the green for the third week in a row with 3.6% gain.
This week, the Relative Strength index (RSI) has crossed above 50 then remained flat highlighting a paused uptrend move.
COPPER DAILY PRICE CHART (May 17, 2018 – April 16 , 2020) Zoomed out


COPPER DAILY PRICE CHART (OCt 12 – April 16, 2020) Zoomed In

Looking at the daily chart, we noticed that a downtrend move led Copper on March 19 to print its lowest level in over four years at $4.371. On March 30, this trend corrected as the price created a higher low at $4.740. On Tuesday, the market climbed to current trading zone $5.010 - $5.239 eyeing a test of the downtrend line originated from the Jan 16 high at $6.342. Any violation to this line would be considered as a bullish signal.
A close above the high end of the zone may cause a rally towards $5.519. Further close above that level could extend this rally towards $5.735. Having said that, the weekly resistance levels underlined on the chart (Zoomed in) should be considered.
On the flip side, any close below the low end of the zone may encourage bears to take charge and press towards $4.484. Further close below that level could send Copper even lower towards $4.318. In that scenario, the daily and weekly support levels marked on the chart should be watched closely.

COPPER Four-HOUR PRICE CHART (Mar 23 – April 16, 2020)
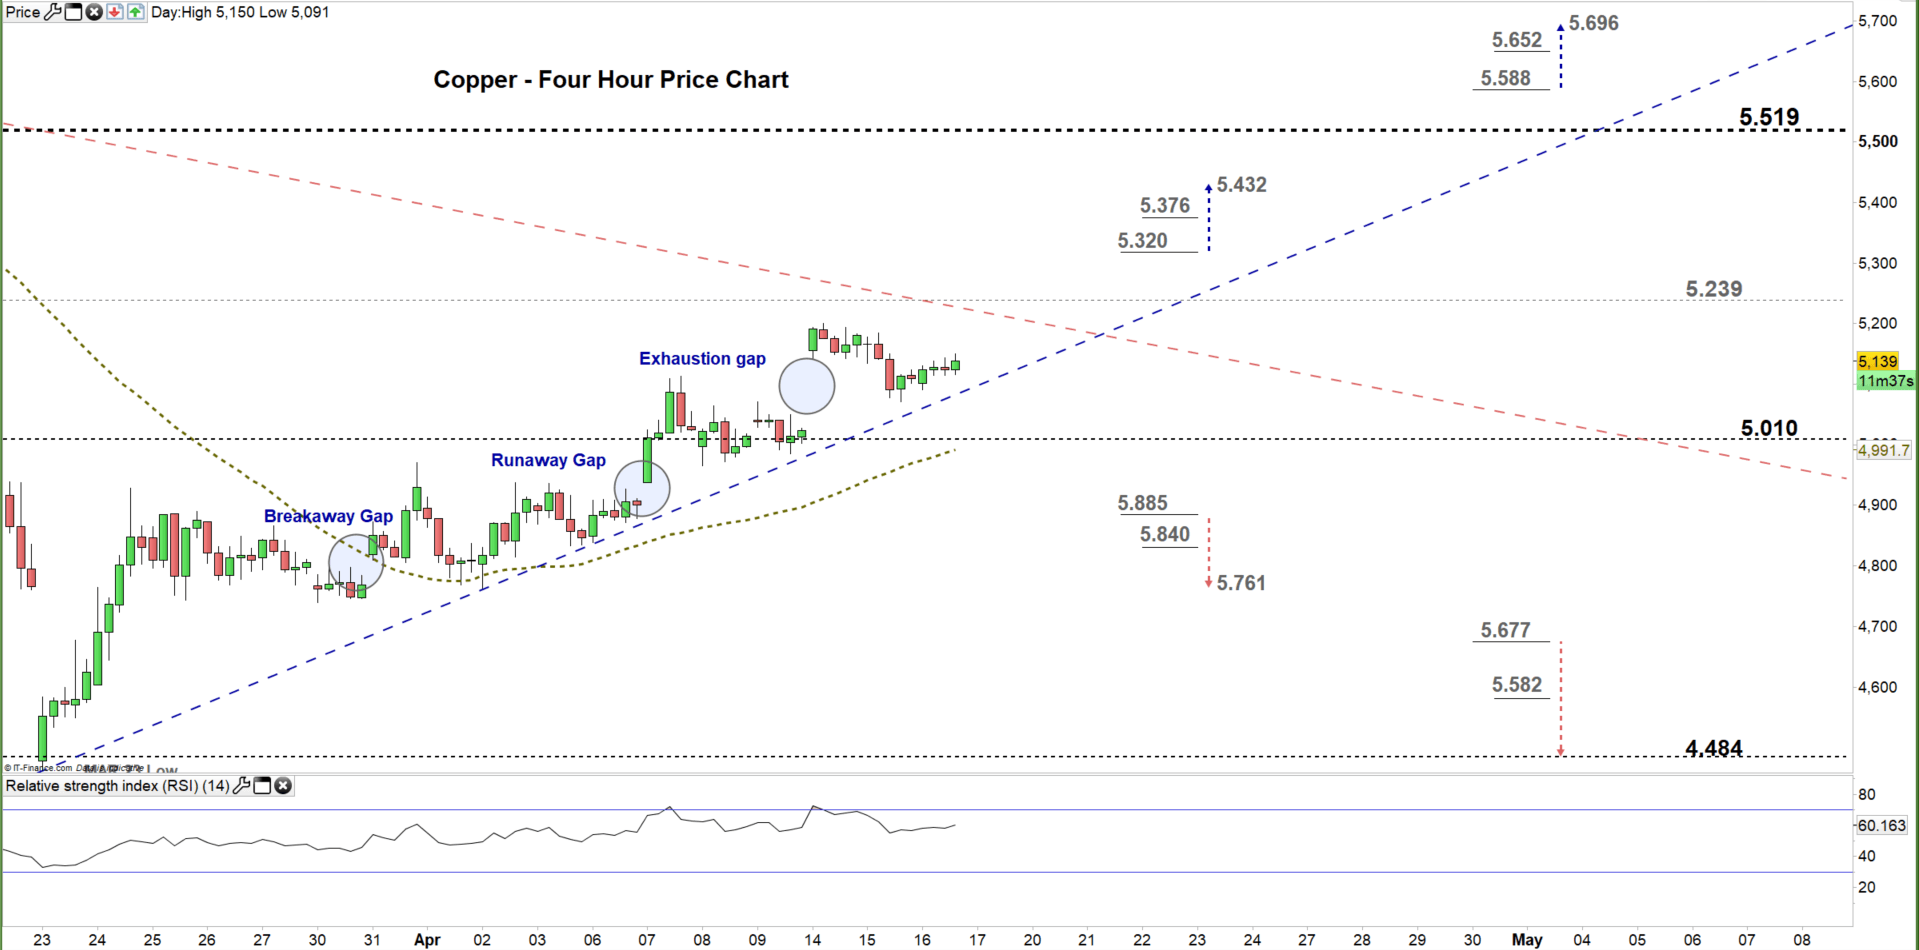
From the four-hour chart, we noticed that by the end of March the price opened with a breakaway gap to the upside then on April 7 opened with a runaway gap. This week, Copper opened with a third upward gap (exhaustion gap) singling that uptrend move nears its end.
A break below $5.885 would be considered as a bearish signal. This could send the price towards $5.761. Although, the daily support level underscored on the chart should be monitored. In turn, any break in the other direction i.e. above $5.320 might cause a rally towards $5.432. Nevertheless, the weekly resistance level underlined on the chart should be kept in focus.
See the chart to know more about the key technical levels in a further bullish/bearish move.
Written By: Mahmoud Alkudsi
Please feel free to contact me on Twitter: @Malkudsi


