


Natural Gas Technical Outlook
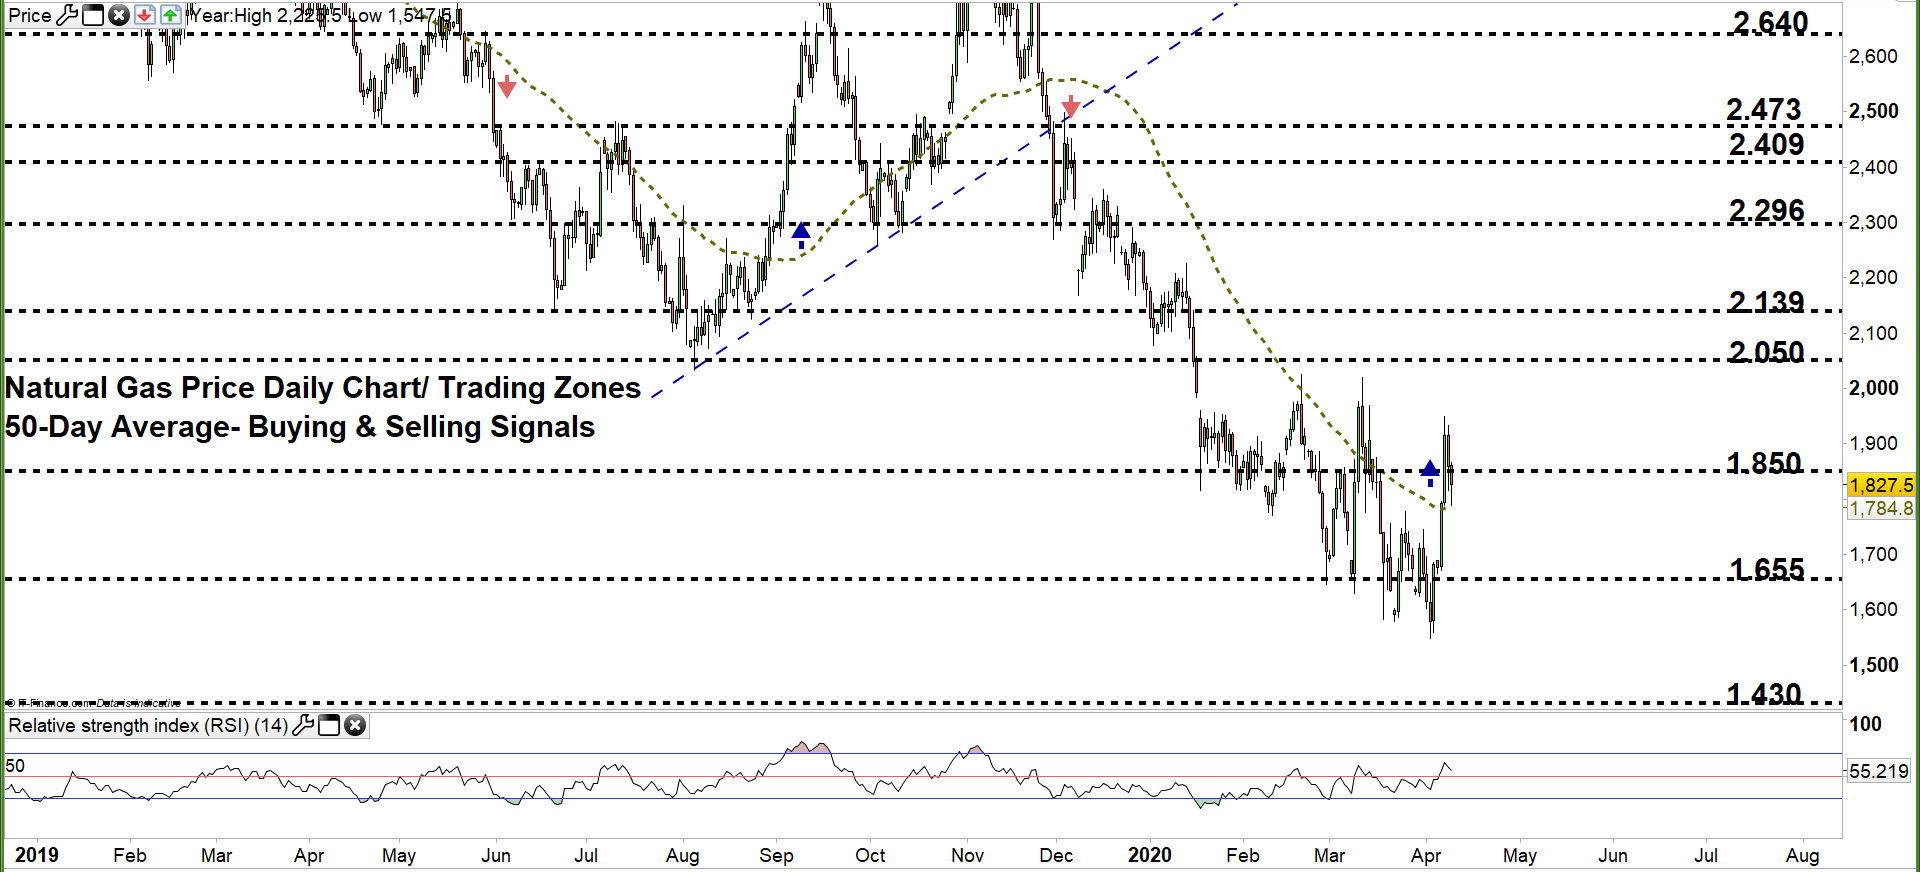
- Natural gas rebounded from over two decades low
- Signals and trading zone to monitor
Natural Gas Price – Bears ease Up
On Thursday, natural gas declined to $1.547- its lowest level in nearly 25 years. However, the market rallied after, as some bears seemed to cover. Consequently, on Friday the weekly candlestick closed in the green with 0.5% gain.
This week, the Relative Strength Index (RSI) crossed above 50, highlighting the end of downtrend move and a possible start of uptrend momentum.
Nat-Gas DAILY Price CHART (Jan 2 , 2019 – April 9, 2020) Zoomed Out

Natural Gas DAILY Price CHART (Jan 22 – April 9, 2020) Zoomed IN
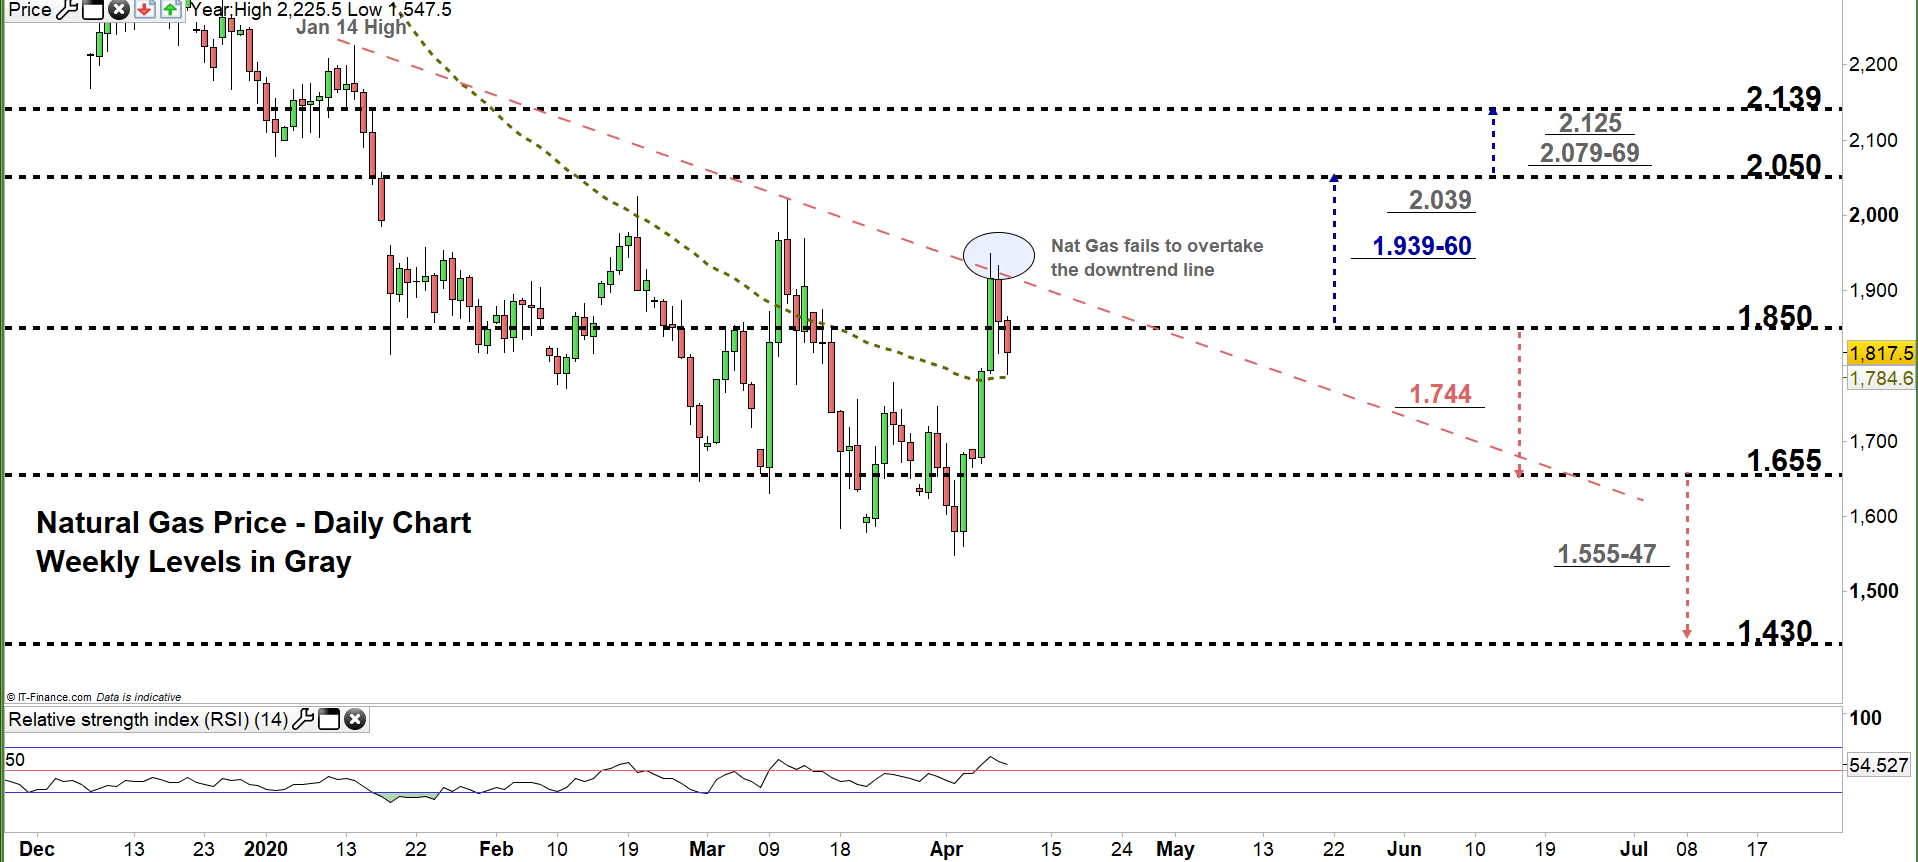
Looking at the daily chart, we noticed that at the start of this week Natural gas surged then closed above the 50-day average generating a bullish signal. Later on, the market climbed to current trading zone $1.850 - $2.050. Although, the price failed to overtake the downtrend line originated from the Jan 14 high at $2.225, indicating a possible bearish comeback.
Thus, a close below the low end of the zone could lead natural gas towards $1.655. Further close below that level may send the price even lower towards $1.430. That said, the daily and weekly support level and area marked on the chart ( zoomed in ) should be kept in focus.
On the flip-side, any failure in closing below the low end of the zone opens the door for a rally towards the high end of the zone. Further close above that level could mean more bullishness towards $2.139. In that scenario, the daily and weekly resistance areas and levels should be monitored.

Natural Gas price Four-Hour PRICE CHART (Mar 25 – April 9, 2020)
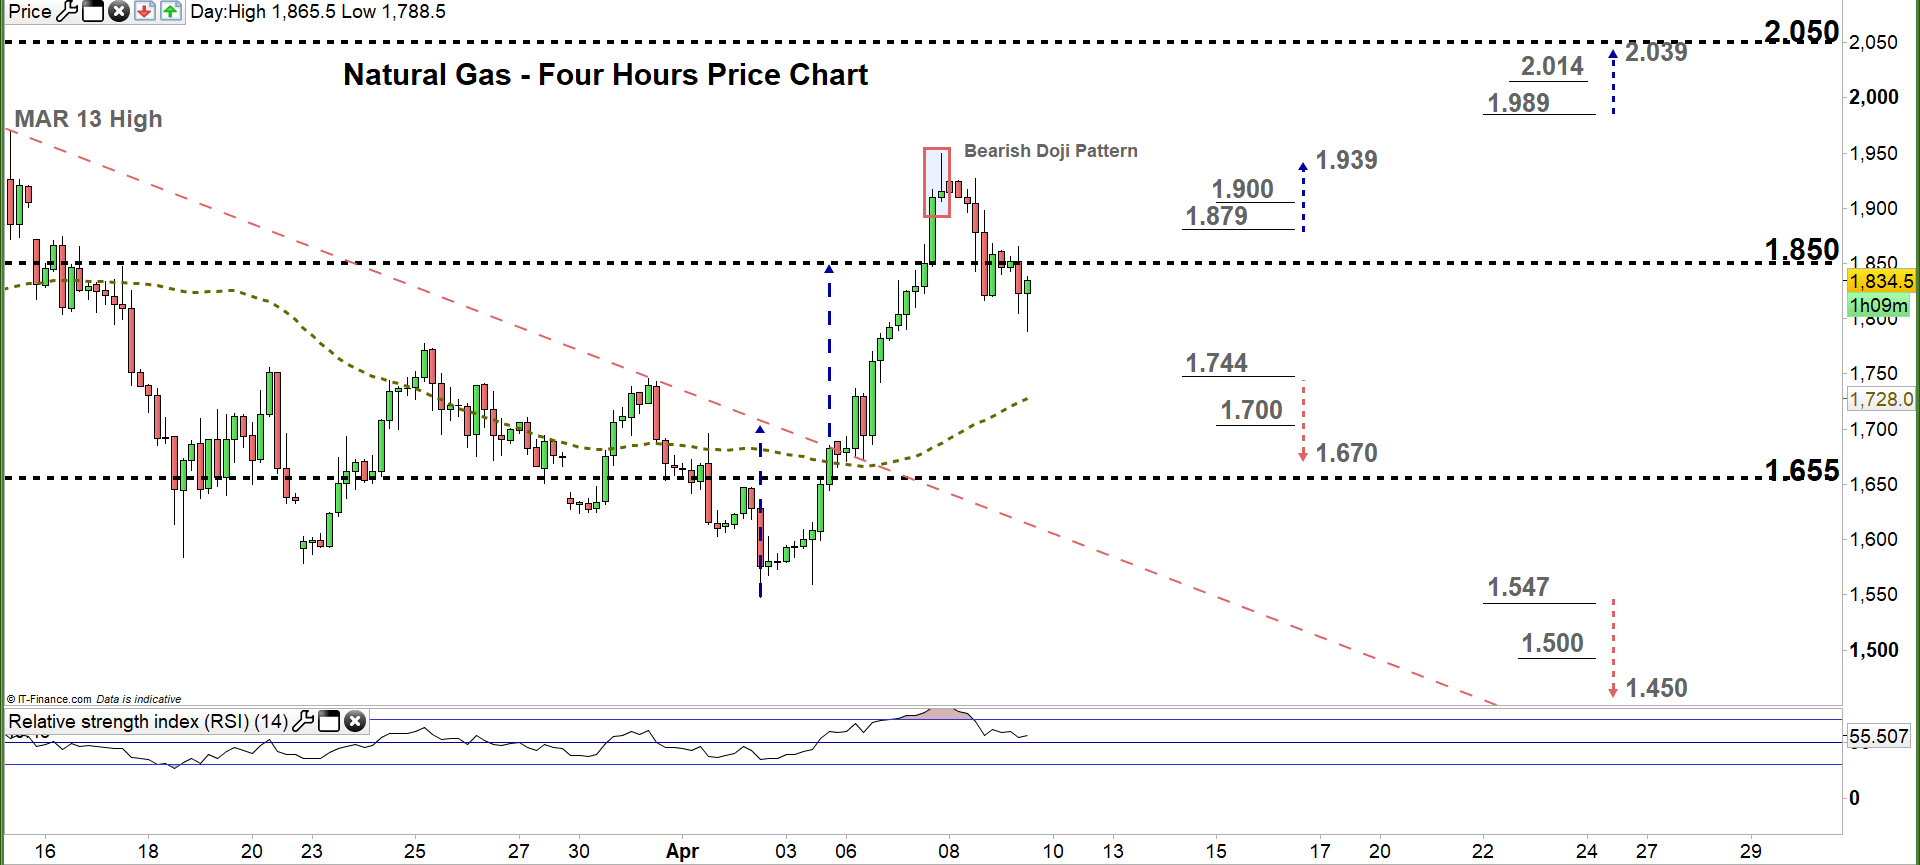
From the four- hour chart, we noticed that on Monday the price violated the downtrend line originated from the March 13 high at $1.969 then took off. In the following day, natural gas rebounded near the $1.950 handle and closed with a bearish Doji pattern.
A break below $1.744 would be considered as an additional bearish signal. This could lead natural gas towards $1.670. Although, the psychological support level underlined on the chart should be considered. In turn, any break in the other direction i.e. above $1.879 may cause a rally towards $1.939. Nevertheless, the psychological resistance level printed on the chart should be watched closely.
See the chart to find out more about the key technical levels to keep in mind in a further bullish/bearish scenario.
Written By: Mahmoud Alkudsi
Please feel free to contact me on Twitter: @Malkudsi


