


Natural Gas Technical Outlook
- Bearish momentum is weaker yet still in tact
- Signals and thresholds to keep in focus
Natural Gas Price – Hesitant Bears
Last week, natural gas rallied to $1.777. Later on, the market reversed and settled below 1.700 handle. On Friday, the price closed the weekly candlestick with 2.3% gain.
The Relative Strength Index (RSI) remained flat below 50 indicating to a stalled downtrend move.
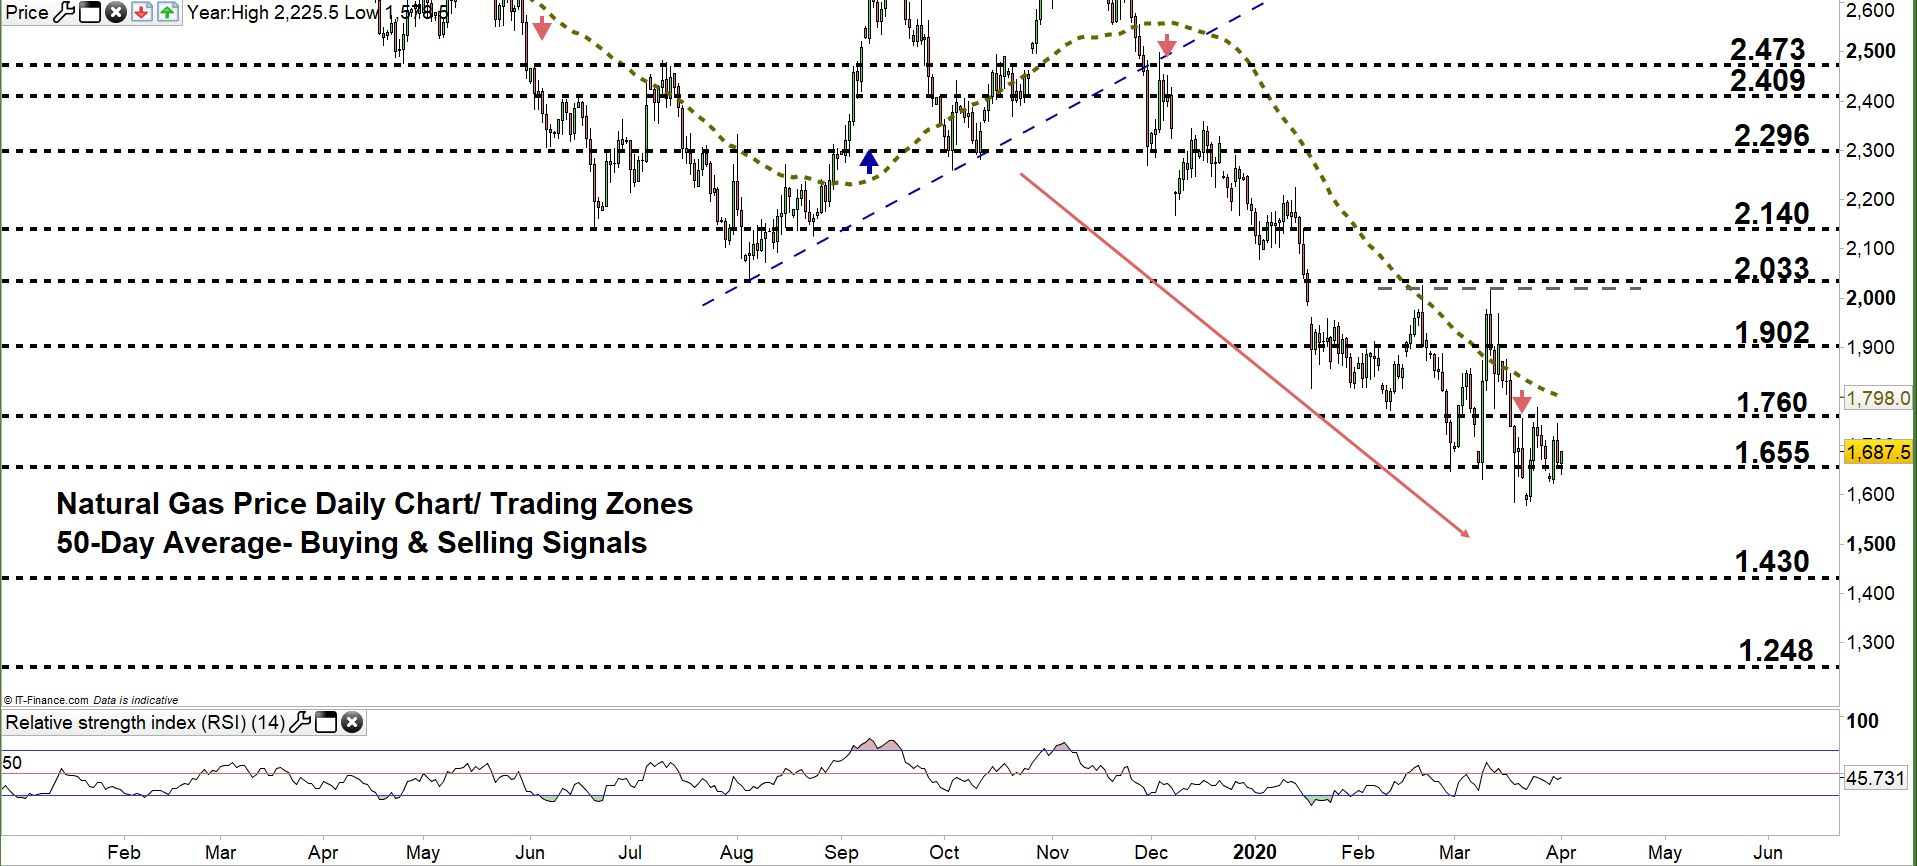
Nat-Gas DAILY Price CHART (Jan 23, 2019 – April 1, 2020) Zoomed Out

Natural Gas DAILY Price CHART (Jan 22 – April 1, 2020) Zoomed IN
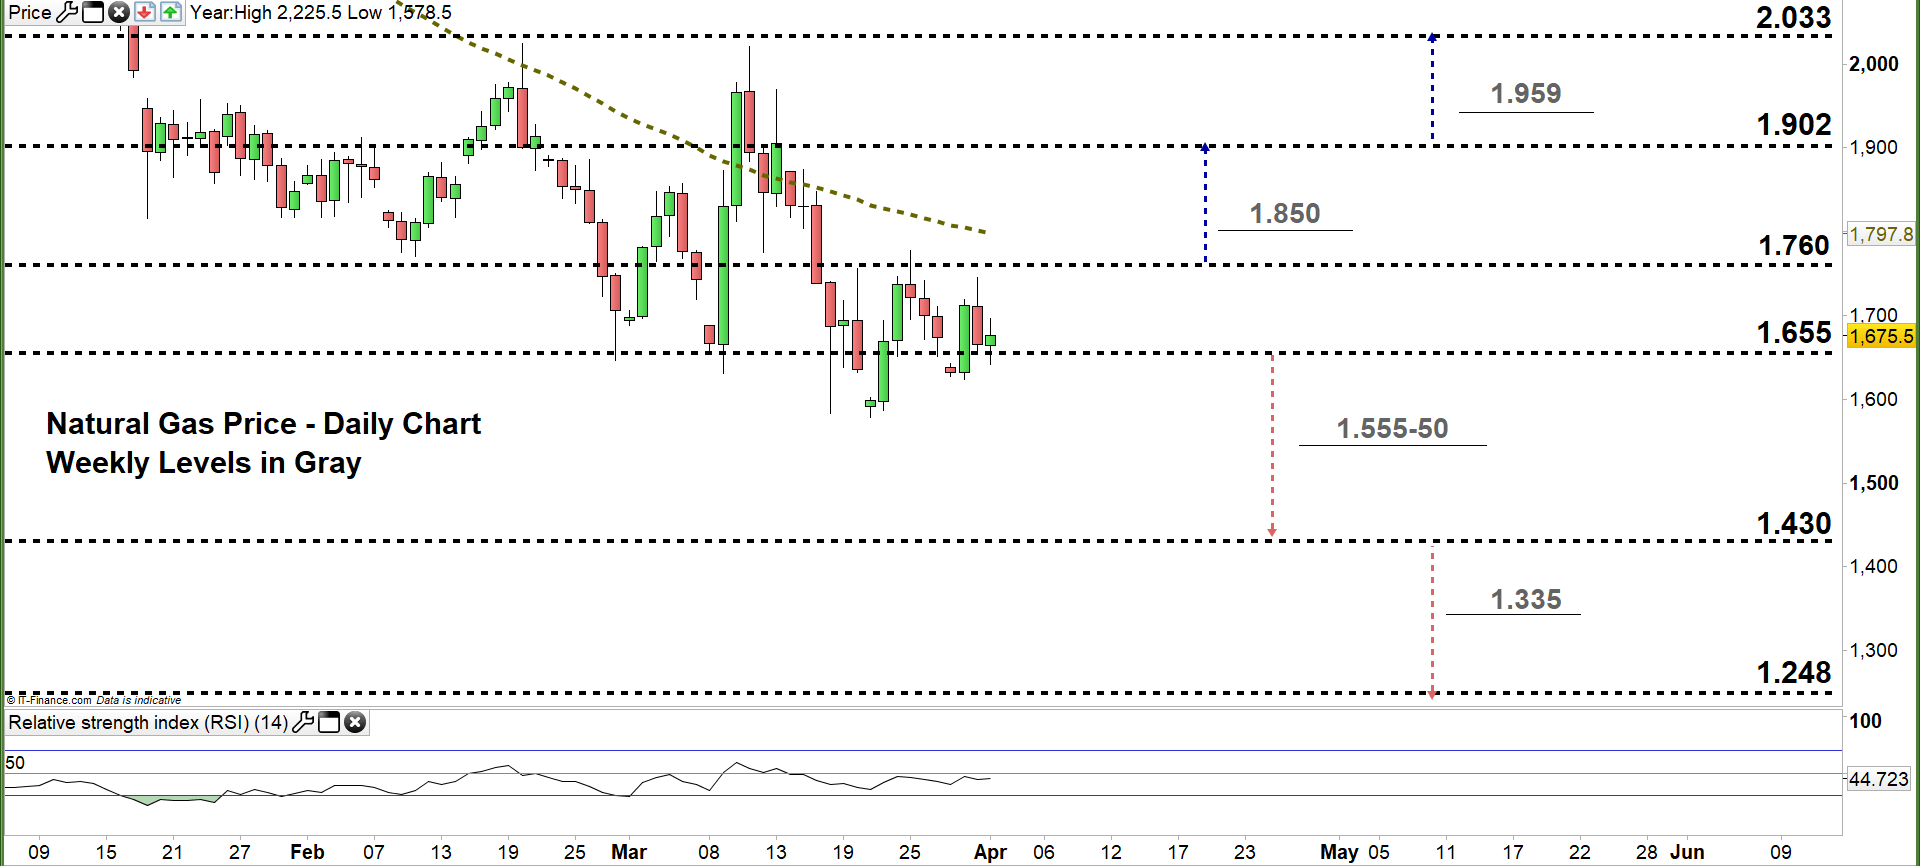
Looking at the daily chart, we noticed that on March 25 natural gas rallied yet failed to move to the higher trading zone indicating of a possible bearish comeback. Yesterday, the price rebounded from the low end of current trading zone $1.655 - $1.760.
Thus, a successful close below the low end may encourage bears to press towards $1.430. Further close below that level could mean more bearishness towards $1.248. That said, the psychological support area with the yearly support levels marked on the chart (zoomed in) should be watched closely.
In turn, any failure in closing below the low end could mean more of the same i.e. a possible rebound towards the high end of the zone. Further close above this level may send the price even higher towards $1.902. Nevertheless, the weekly resistance level underlined on the chart would be worth monitoring.

Natural Gas price Four-Hour PRICE CHART (Mar 12 – April 1, 2020)
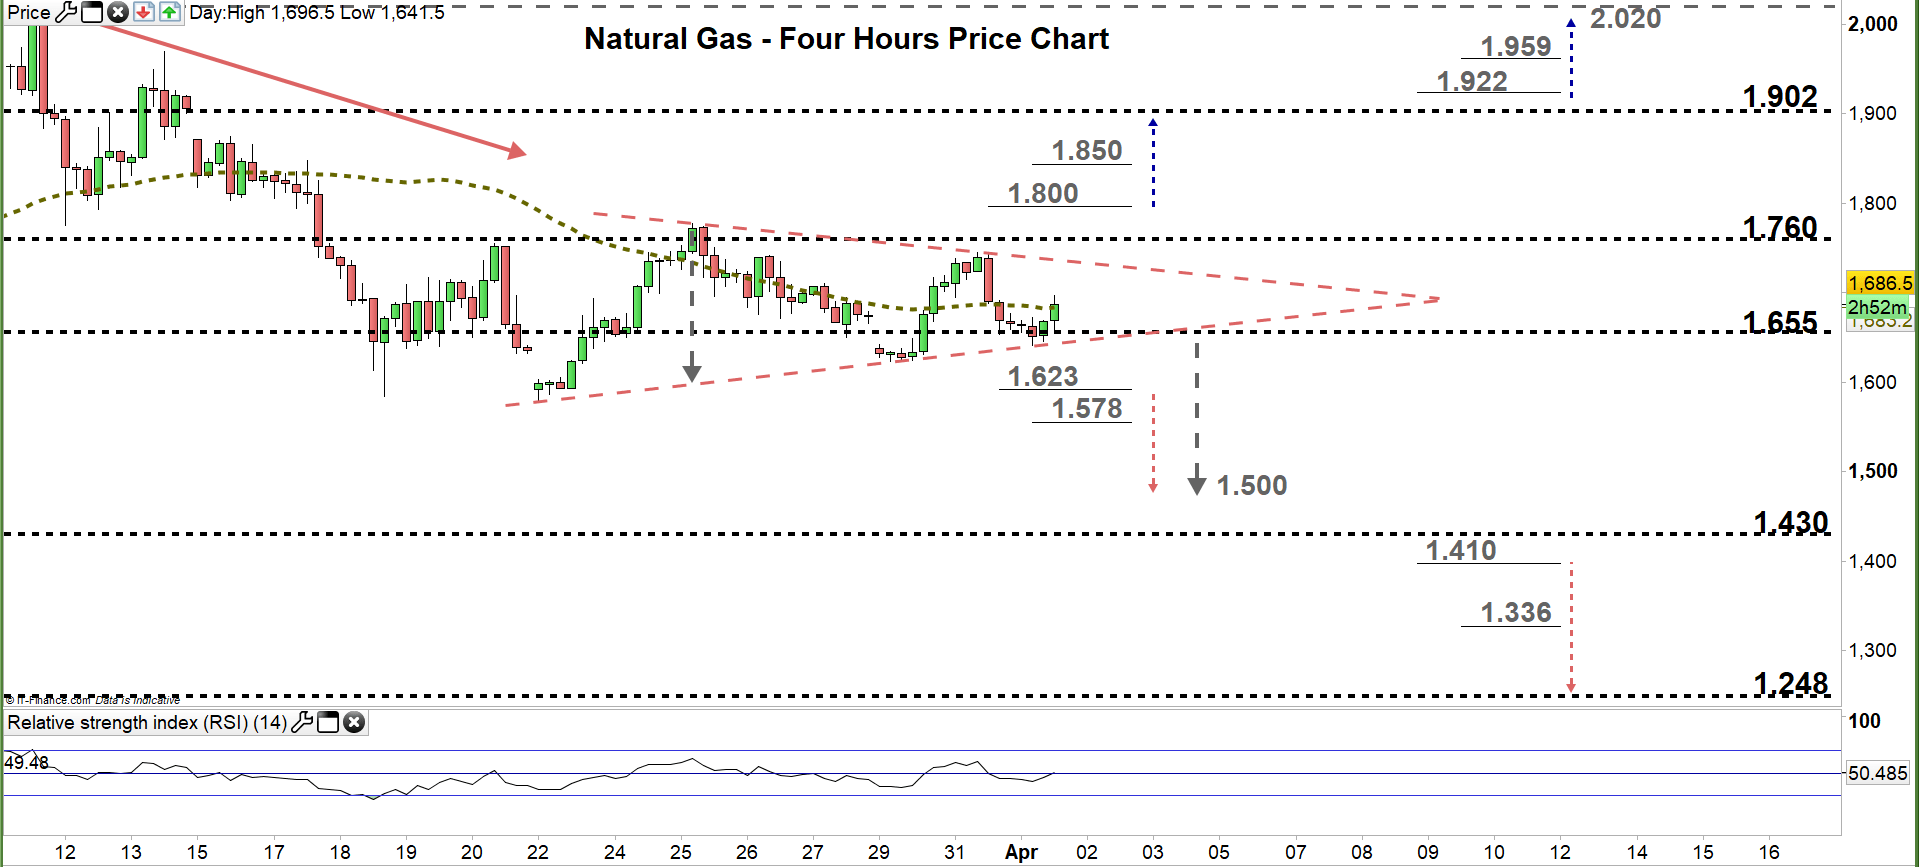
From the four- hour chart, we noticed that on March 22 natural gas downtrend move paused and the price developed a descending triangle. Therefore, any violation of the lower line of the triangle could send the market towards $1.500 handle.
A break below $1.623 would be considered an additional bearish signal. This may increase the likelihood for natural gas to test $1.500 handle. Although the daily support level underscored on the chart should be considered. On the other hand, any break in the other direction i.e. above $1.800 could send the price towards $1.902. Yet, the weekly resistance level printed on the chart should be kept in focus.
See the chart to find out more about the key technical levels to keep in mind in a further bullish/bearish scenario.
Written By: Mahmoud Alkudsi
Please feel free to contact me on Twitter: @Malkudsi


