


Bitcoin Price Technical Outlook
- Bears ease up, yet still in charge
- Key levels and thresholds to know
BTC/USD – Bears Pullback
On March 13, Bitcoin rebounded from multi-month low at 3.908 then rallied after as bears seemed to cover. Last week, BTC/USD recovered some of its previous losses then closed the weekly candlestick in the green with 9.5% gain.
The Relative Strength Index (RSI) abandoned the oversold territory reflecting weaker downtrend momentum.
Bitcoin PRICE DAILY CHART (April 2, 2018 – Mar 23, 2020) Zoomed Out


Bitcoin PRICE DAILY CHART (JAN 1 – Mar 23, 2020) Zoomed In

Looking at the daily chart, we noticed that on March 13 the price rebounded from $3.908 then rallied as bear eased up. On Thursday, the market rallied to current trading zone $5.625 - $6.540. Later on, the price failed to move to the higher zone hinting that bears may come back.
Thus, a close below the low end of the zone might encourage bears to press towards $4.186. Further close below that level could send BTC/USD even lower towards $2.977. Nevertheless, the daily support levels underlined on the chart (zoomed in) should be monitored.
On the flipside, any close above the high end of the zone might cause a rally towards $7.824. Further close above that level could extend the rally towards $9.080. In that scenario, the daily and weekly resistance levels marked on the chart should be watched closely.

Bitcoin PRICE FOUR Hour CHART (Mar 1 – Mar 23, 2020)
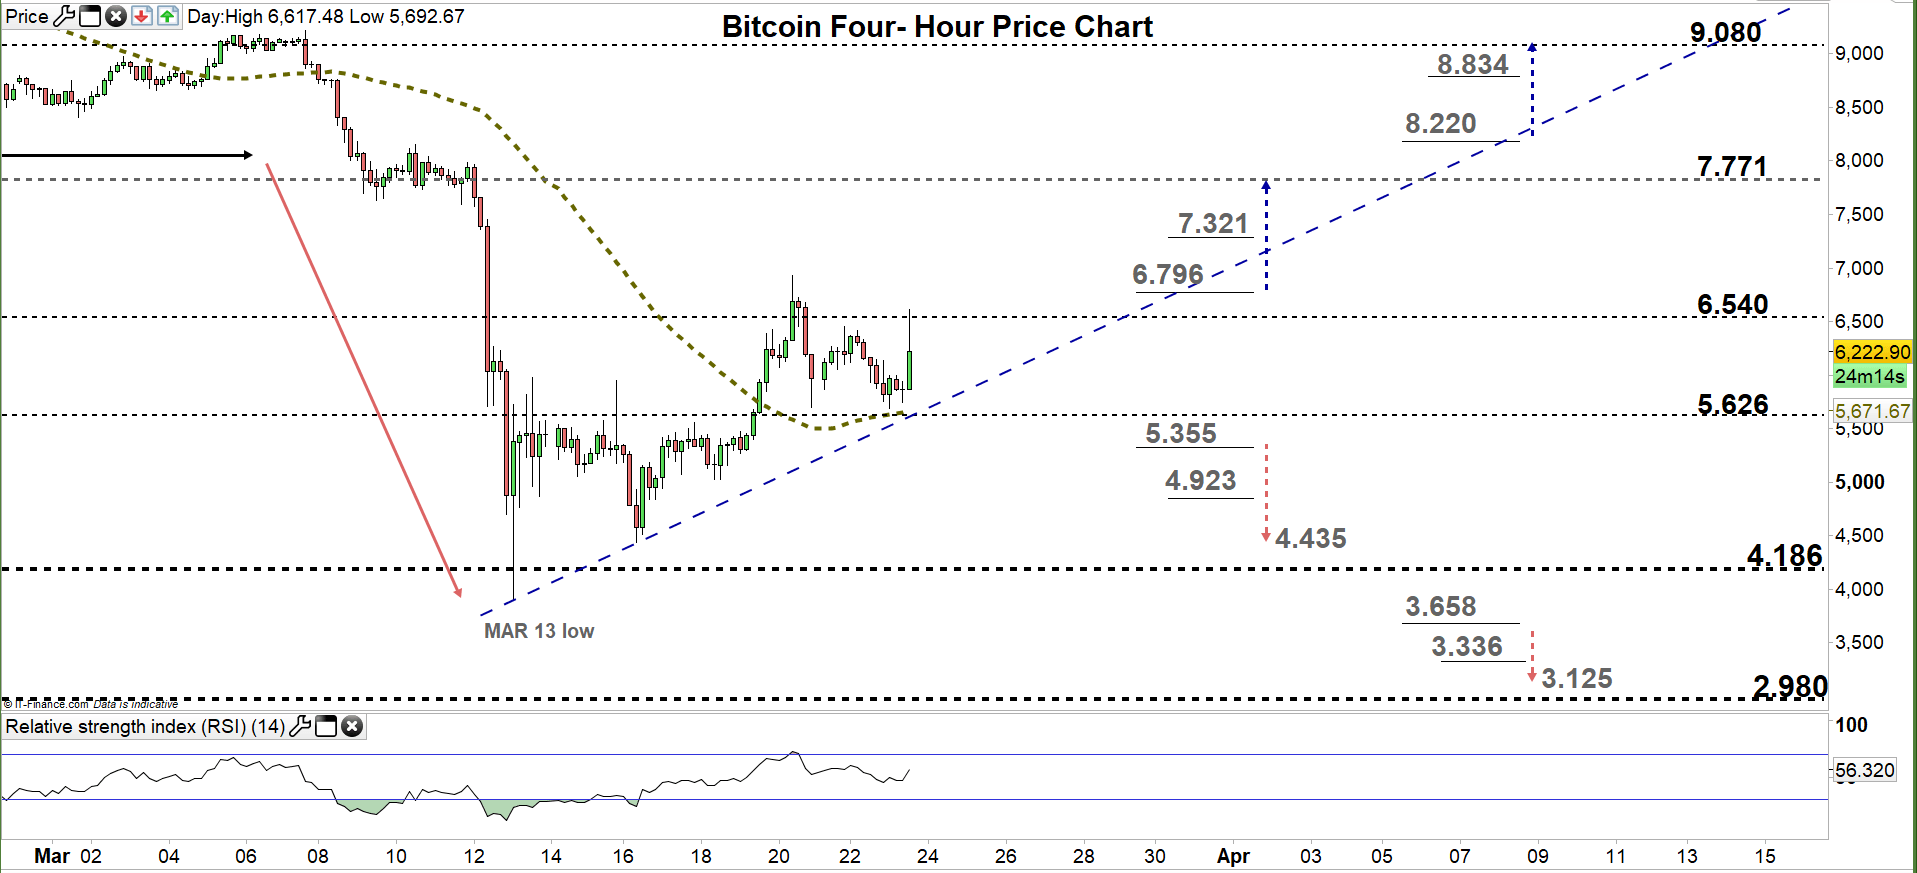
Looking at the four-hour chart, we noticed that on Monday the downtrend move corrected as created a higher low at $4.435. Its noteworthy that, any violation to the uptrend move originated from the March 13 low (discussed above in the daily chart) would be considered a bearish signal.
Thus, a break below $5.355 could send BTC/USD towards $4.435. That said, the daily support level underscored on the chart should be kept in focus. On the other hand, any break above $5.796 could start a rally towards $7.771. Yet, the weekly resistance level printed on the chart should be considered.
See the chart to know more about the critical levels in a further bearish/ bullish move.

Written By: Mahmoud Alkudsi
Please feel free to contact me on Twitter: @Malkudsi


