


Bitcoin Price Technical Outlook
- BTC/USD charts highlights bearish signals
- Key levels and thresholds to know
BTC/USD – Bears Are Back
Last week, Bitcoin rallied to $9.178 then closed the weekly candlestick in the green with 5.3% gain. However, yesterday the price broke below $8.000 handle for the first time in nearly eight weeks highlighting that bears were back.
On Friday, the Relative Strength Index (RSI) failed to cross above 50 indicating that downtrend move were still intact.
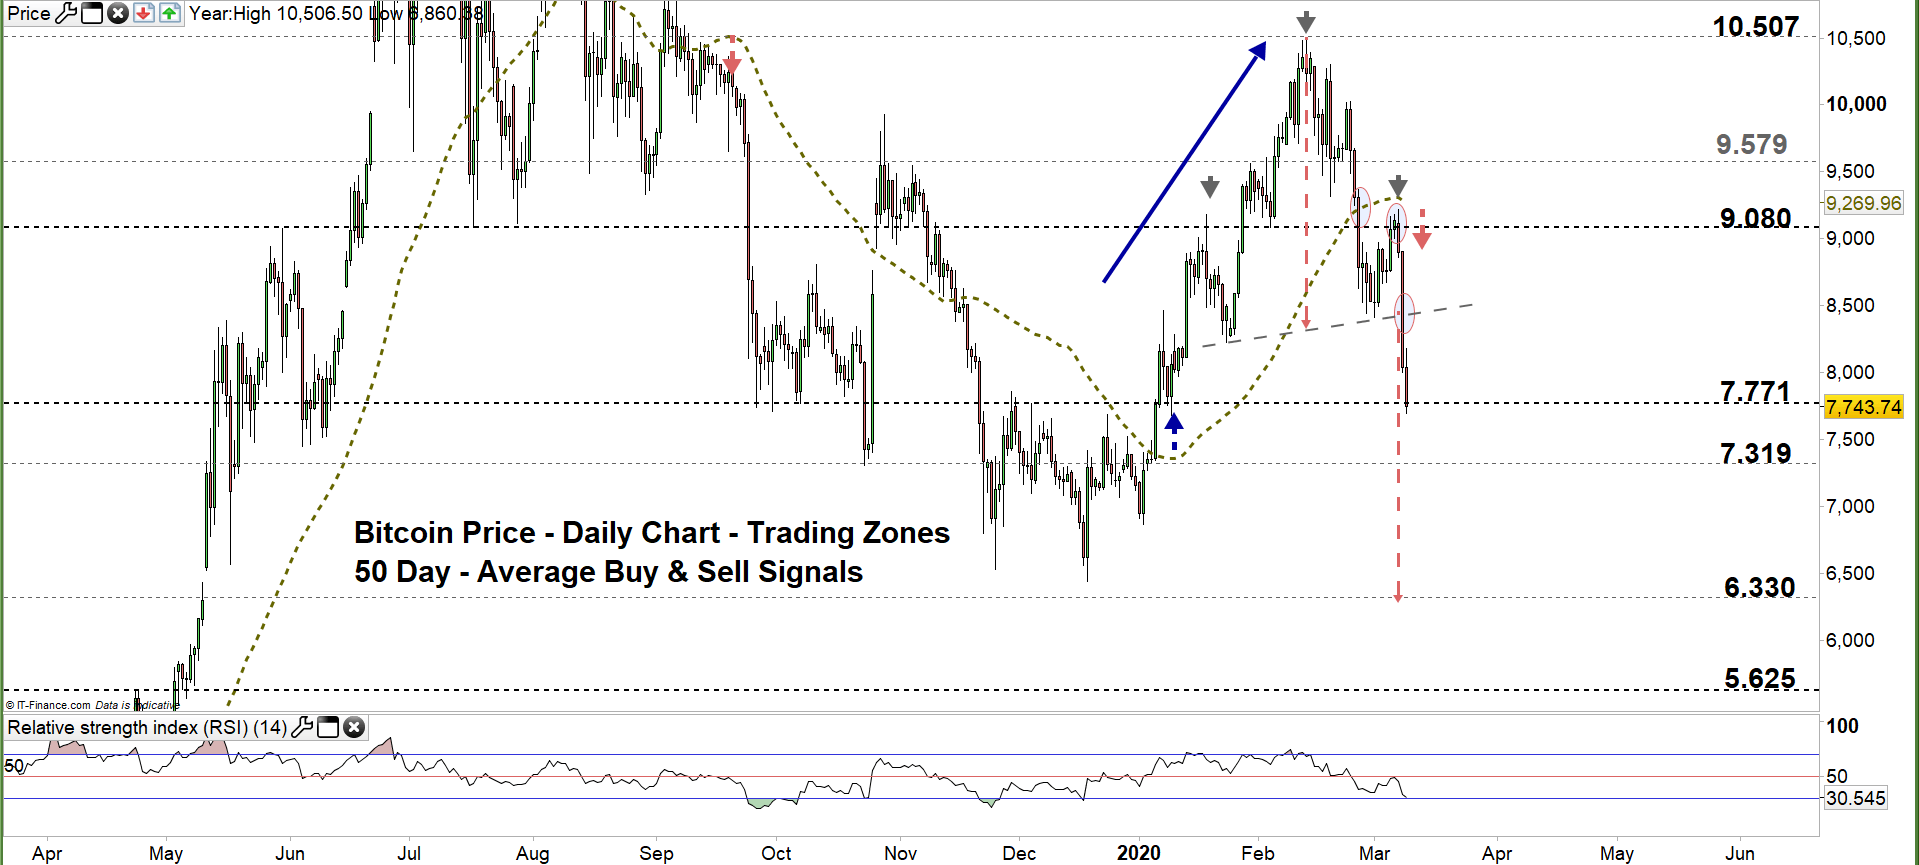
Bitcoin PRICE DAILY CHART (April 2, 2018 – Mar 9, 2020) Zoomed Out

Bitcoin PRICE DAILY CHART (Dec 1 – Mar 9, 2020) Zoomed In
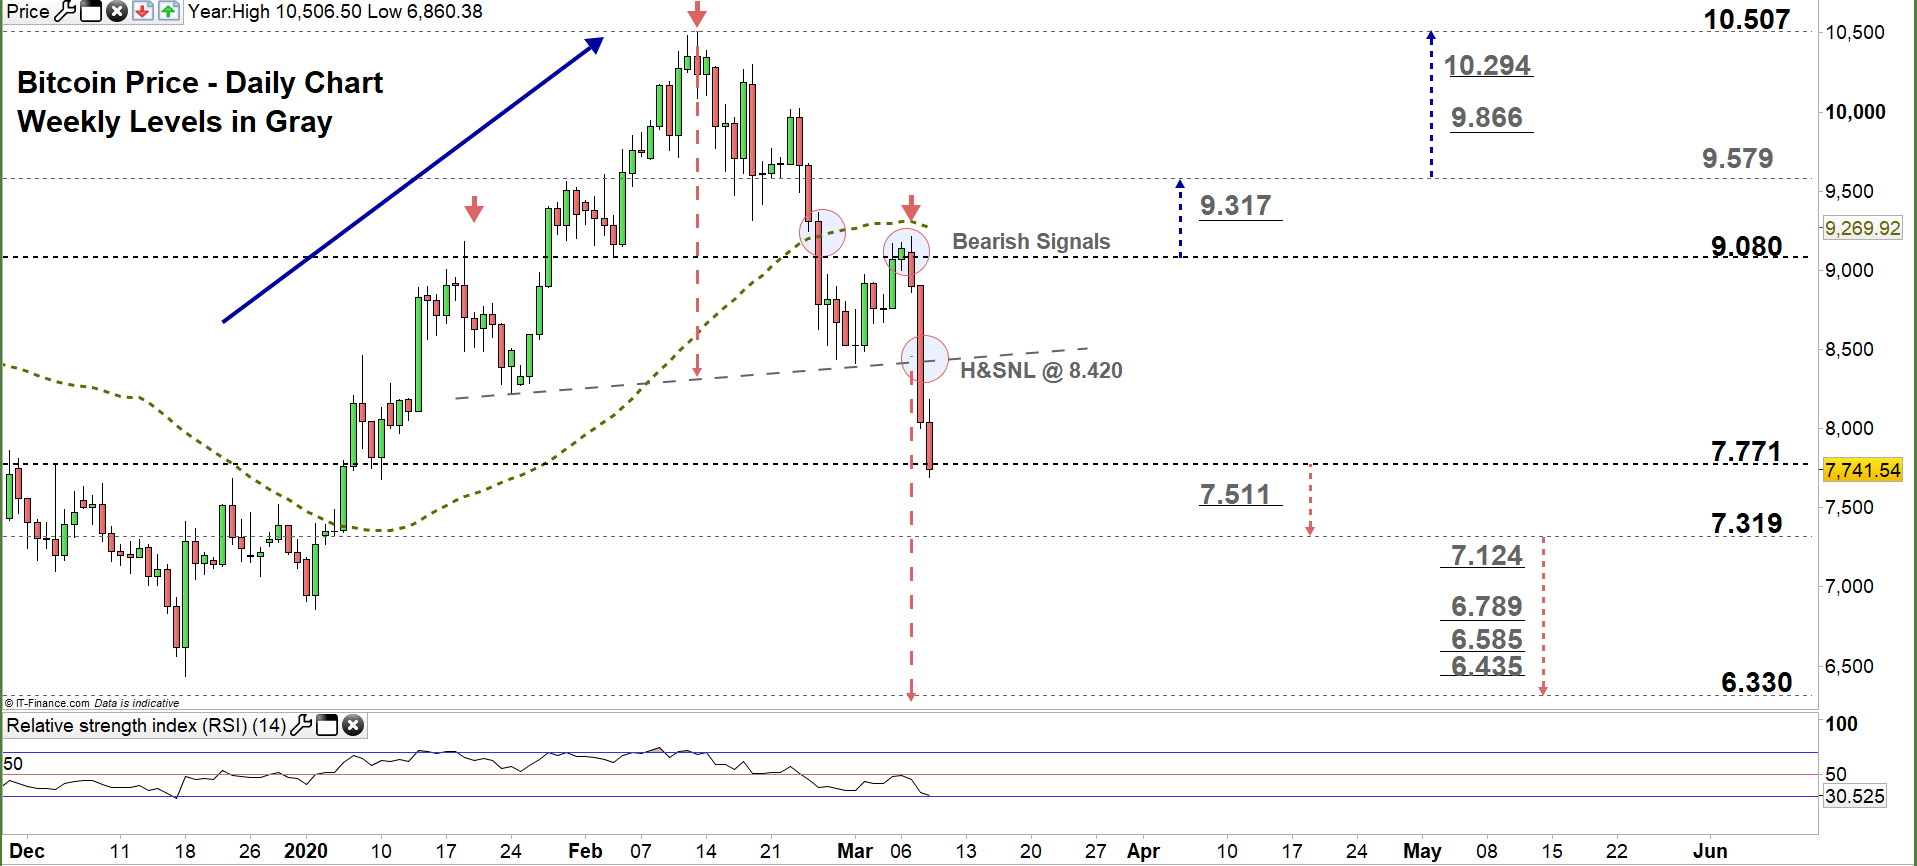
Looking at the daily chart, we noticed that last week Bitcoin could not test the 50-day average reflecting bulls’ hesitation. Yesterday, the crypto currency broke below the neckline of head and shoulders pattern located at $8.420 eyeing a test of $6.330. Today, the price has tested the low end of current trading zone $7.771- $9.080.
Thus, a close below the low end of the zone may encourage bears to press towards 7.319. Further close below this level could mean more bearishness towards $6.330. That said, the weekly support levels underlined on the chart (zoomed in) should be considered.
On the other hand, any failure in closing below the low end of the zone signals bears reluctance. This could lead some of them to exit the market causing a rally towards the high end of the zone. Further close above that level could push the price even higher towards $9.579. Nevertheless, the weekly resistance level underscored on the chart should be kept in focus.

Bitcoin PRICE FOUR Hour CHART (Sep 13 – Mar 9, 2020)

Looking at the four-hour chart, we noticed that on March 4 Bitcoin corrected its downtrend move and created a higher low at $8,662. On Saturday, Bitcoin broke below the uptrend line originated from the March 1 low at $8.408 generating a bearish signal. Yesterday, the price fell below the aforementioned March 1 low and resumed bearish price action.
Hence, a break below $7.614 could send BTC/USD even lower towards $7.319. Although, the weekly support level printed on the chart should be monitored. In turn, a break above $8.630 might cause a rally towards the high end of current trading zone discussed above on the daily chart. Yet, the daily resistance level marked on the chart should be watched closely.
See the chart to know more about the critical levels in a further bearish/ bullish move.

Written By: Mahmoud Alkudsi
Please feel free to contact me on Twitter: @Malkudsi


