


Dow Jones Price Outlook
- Dow Jones chart highlights a possible price reversal
- Levels and signals to consider
Dow Jones – All Time High
Last week, the Dow jones index rallied to 29.402 – its highest level ever. On Friday, the weekly candlestick closed on Friday in the green with 1.7% gain.
The Relative Strength Index (RSI) remained flat above 50 reflecting a weaker uptrend momentum.
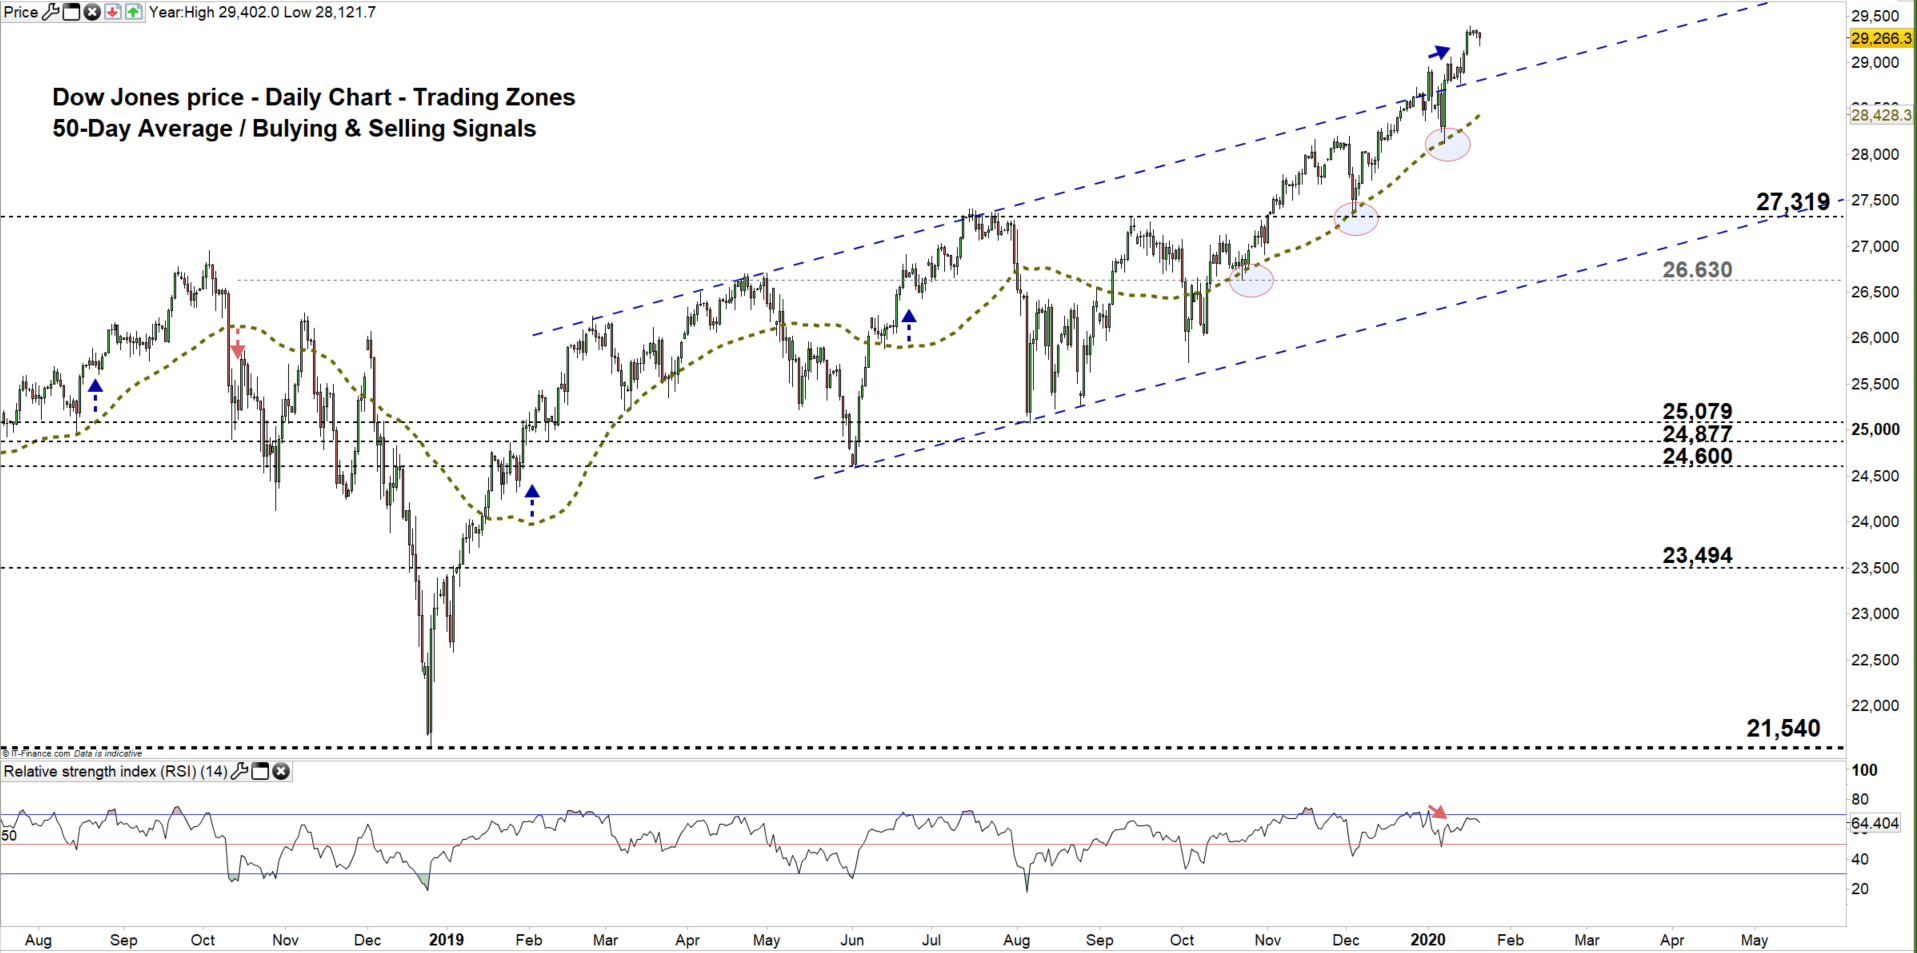
Dow Jones PRICE Daily CHART (July 1, 2018 – Jan 21, 2020) Zoomed OUT

Dow Jones PRICE Daily CHART (AUg 8 – Jan 21, 2020) Zoomed IN
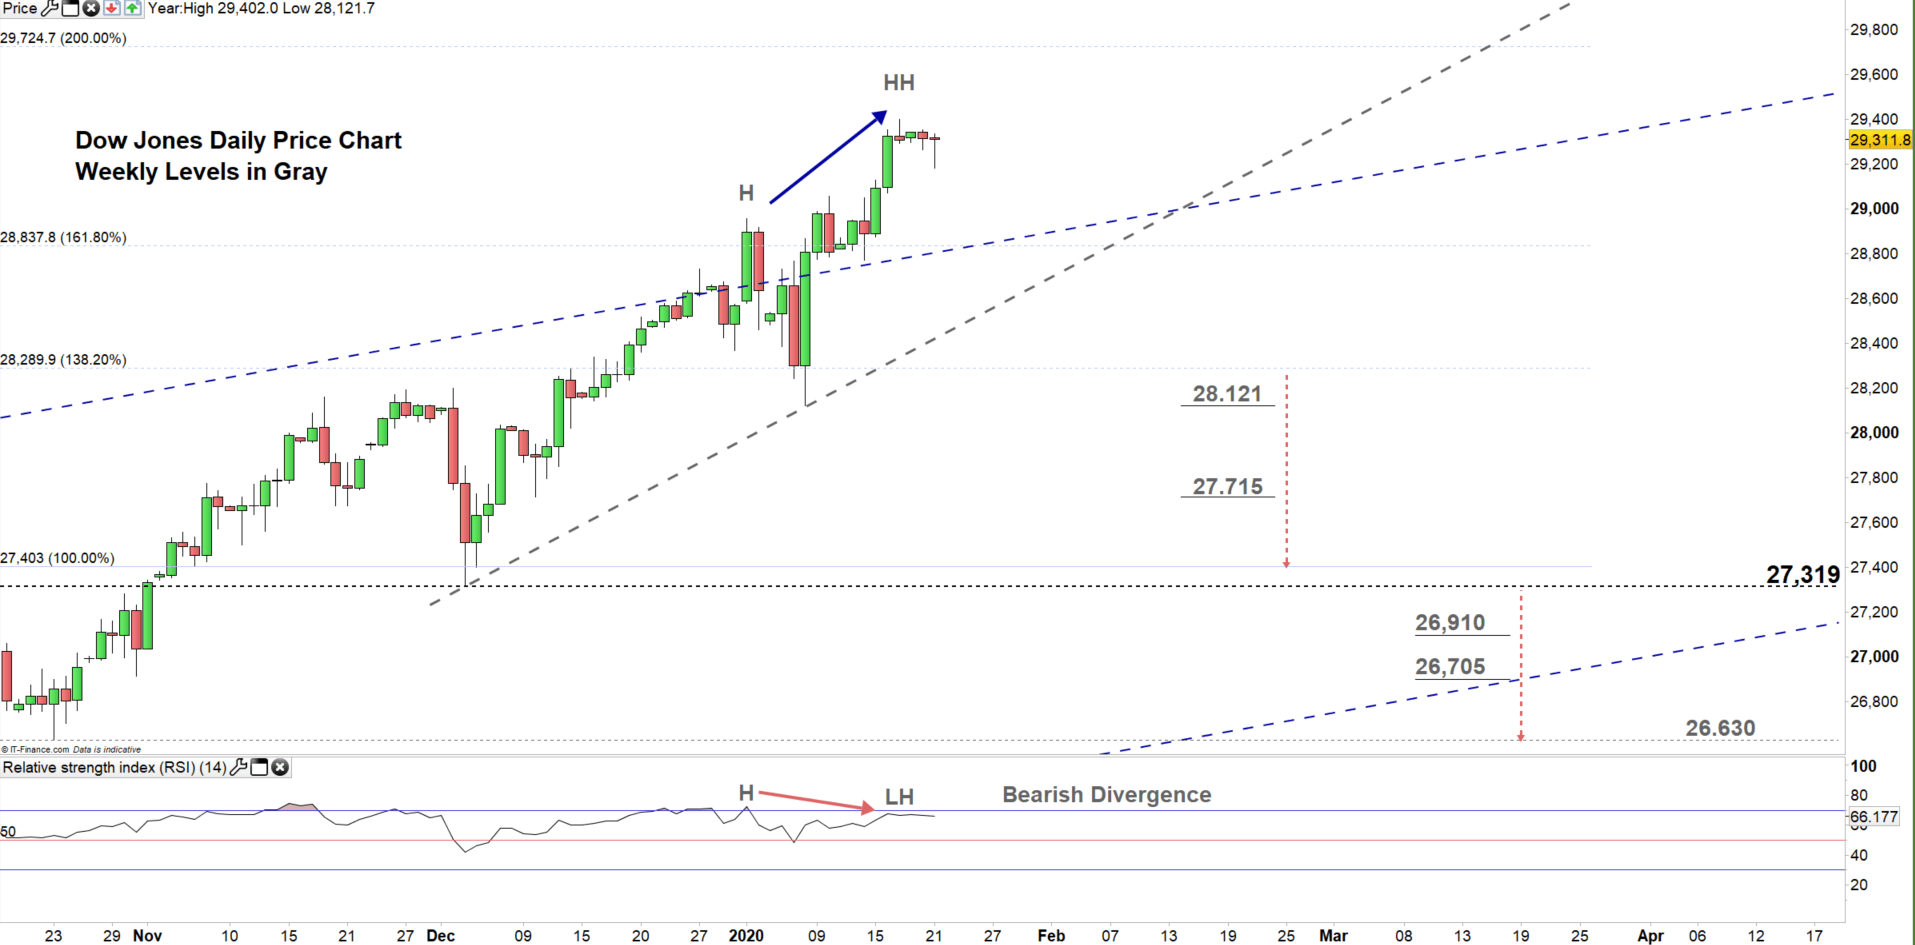
Looking at the daily chart, we notice on Jan 14 rallied to a higher trading zone 28,837 – 29,724. Additionally, we spot a bearish divergence RSI and the price (a high with a higher high on the price with high and a lower high on the oscillator). This signals a possible uptrend's reversal.
Any failure in closing above the high end of the zone might lead the Dow bulls to ease up and possibly could reverse the price’s direction towards the low end of the zone.
A close below the low end of the zone may convince more bulls to cut back. This could press the price towards the 138.20 % Fibonacci extension at 28,289. Further close below this level could push more bulls to cut back and send the price towards 27,403. That said, the weekly support levels underlined on the chart (zoomed in) should be considered.

Dow Jones Four Hour PRICE CHART (DEC 20, 2018 – Jan 21, 2020)
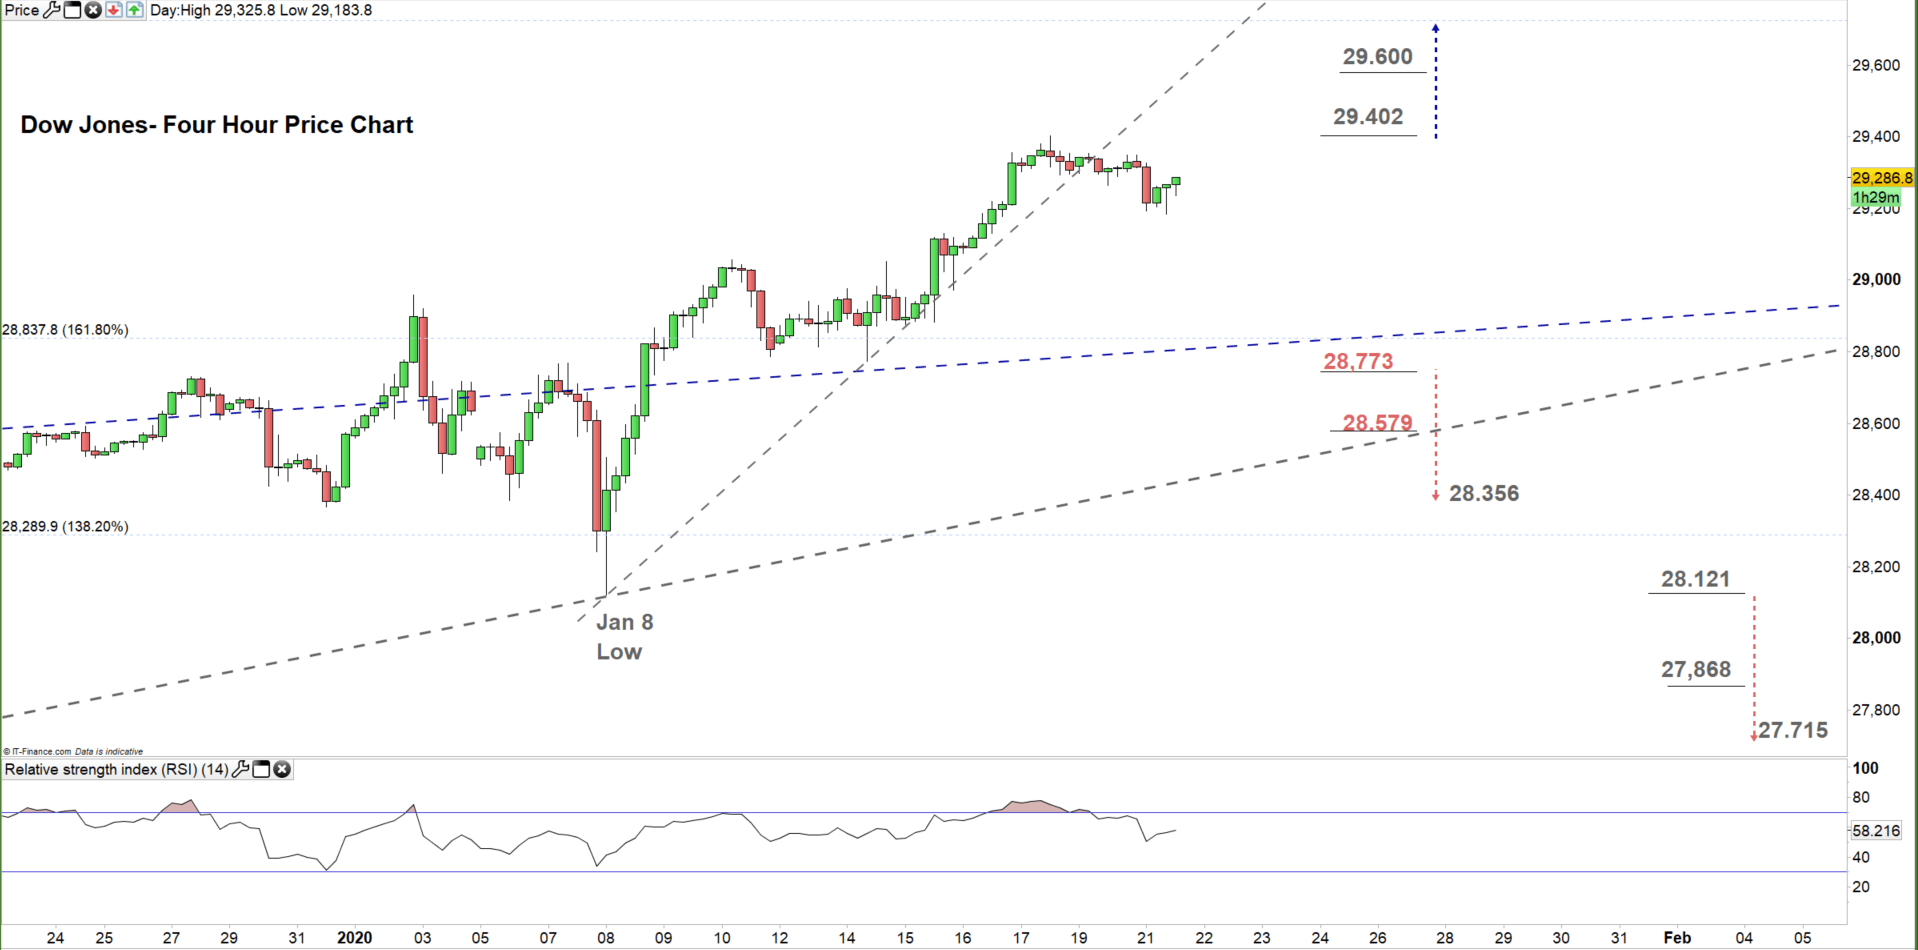
Looking at the daily chart, we notice yesterday, the Dow broke below the uptrend line originated from the Jan 8 low at 28.121 and generated a bearish signal.
A break below 28.773 could send the price towards 28.356. Yet, the daily support level underlined on the chart should be kept in focus. On the other hand, a break above 29.402 could push the Dow towards the high end of the current trading zone discussed above on the daily chart. That said, the 29.600 handle should be monitored.
Written By: Mahmoud Alkudsi
Please feel free to contact me on Twitter: @Malkudsi


