


Australian Dollar Technical Analysis, New Zealand Dollar, AUD/NZD – TALKING POINTS
- Australian Dollar outlook bearish as AUD/NZD breaks key support
- Since early November, the pair has shaved off almost five percent
- Looking ahead, what are key support, resistance levels to monitor?
AUD/NZD Technical Outlook
Since early November, AUD/NZD has incurred losses just under five percent, and recent price action suggests there may be more pain ahead. Following the pair’s failure to break above the August 2015 resistance channel, the pair plunged and shattered several floors along the way. Extending the metaphor, AUD/NZD is now in the proverbial basement, less than one percent away from a critical support range between 1.02650 and 1.0289.
AUD/NZD – Daily Chart
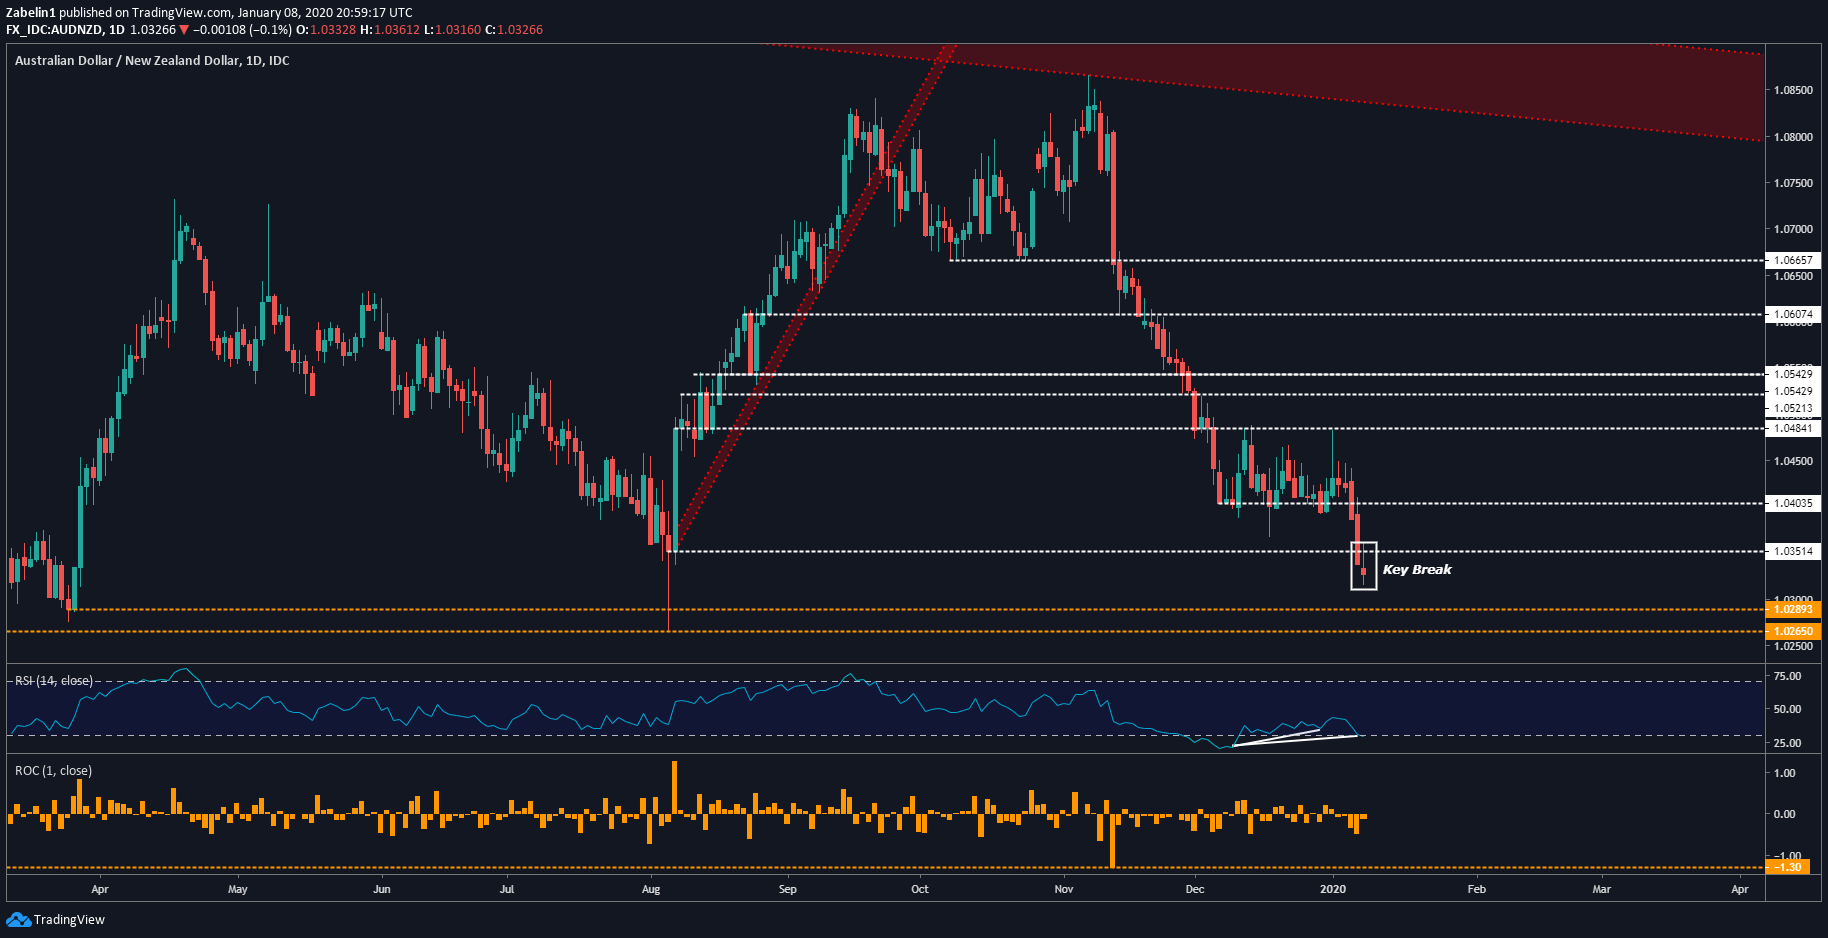
AUD/NZD chart created using TradingView
A bounce back from this multi-tiered floor opens the door to re-testing support-turned-resistance at 1.0351, and technical cues are hinting a turn higher could be in the cards. Positive RSI divergence is signaling downside momentum is slowing, though this in no way guarantees that the pair will necessarily flip. However, even if the pair manages to stage a minor recovery, the longer-term outlook suggests these interim gains may be inconsequential.
Looking at a monthly chart shows a gloomy outlook for AUD/NZD. Since reaching its peak March 2011, the pair retreated over 20 percent. Shortly after, it entered what appears to be a multi-year consolidation period. Its vague resemblance to a continuation pattern known as a Symmetrical Triangle suggests that a downside breakout below the lower support zone could catalyze a resumption of the prior downtrend.
AUD/NZD – Monthly Chart

AUD/NZD chart created using TradingView
AUSTRALIAN DOLLAR TRADING RESOURCES
--- Written by Dimitri Zabelin, Jr Currency Analyst for DailyFX.com
To contact Dimitri, use the comments section below or @ZabelinDimitri on Twitter


