


Copper Outlook
- Copper price action
- Copper chart and analysis.
Check our latest forecasts for Gold, EUR and USD and find out for free what might move the price in Q4 this year.
Copper Price – Correcting Lower
On Nov 27, Copper corrected uptrend move and created a lower high at $5,968. On Friday, price closed the weekly candlestick with a Doji pattern highlighting the market’s indecision at this stage.
This week, the relative Strength index (RSI) remained nearby 50, reflecting no clear momentum with weak sellers and weaker buyers.
Having trouble with your trading strategy? Here’s the #1 Mistake That Traders Make
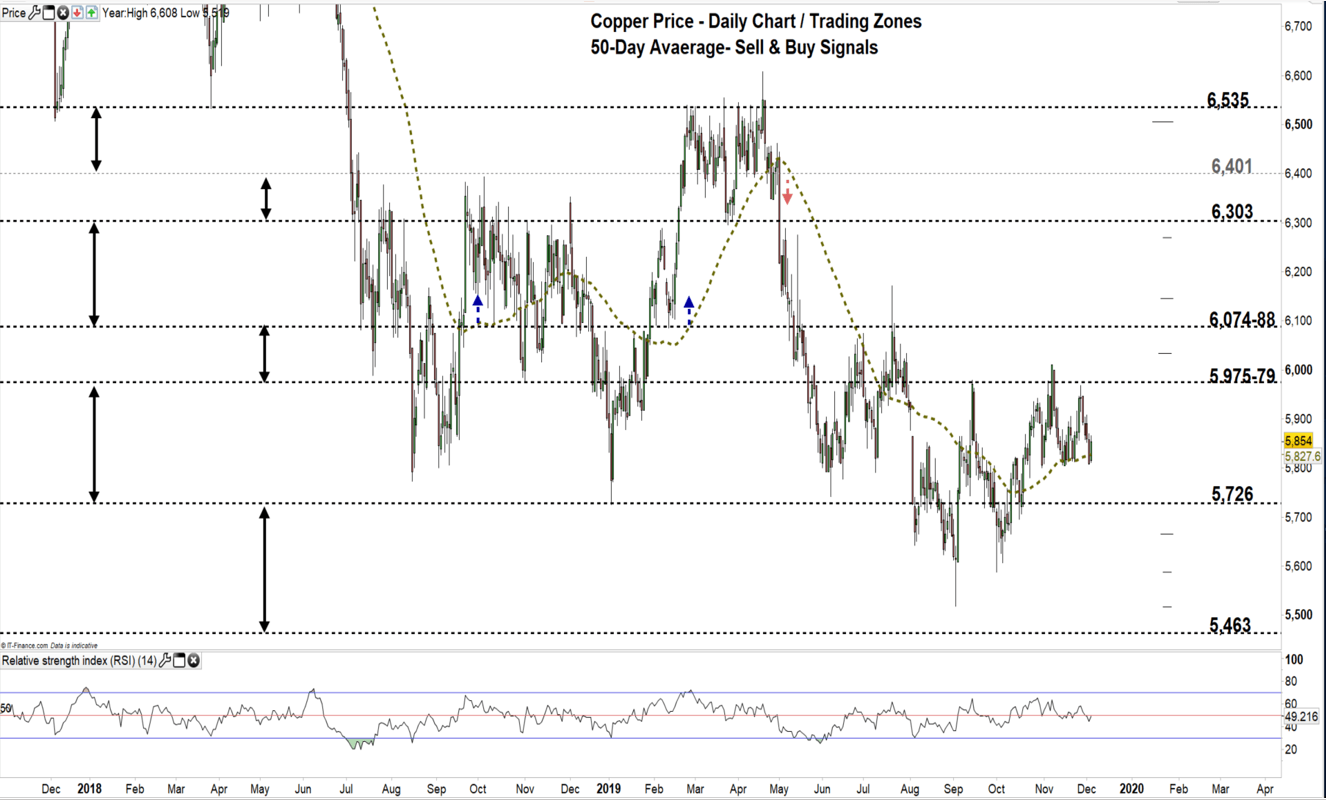
Copper DAILY PRICE CHART (Nov 19, 2016 – DEC 4, 2019) Zoomed out
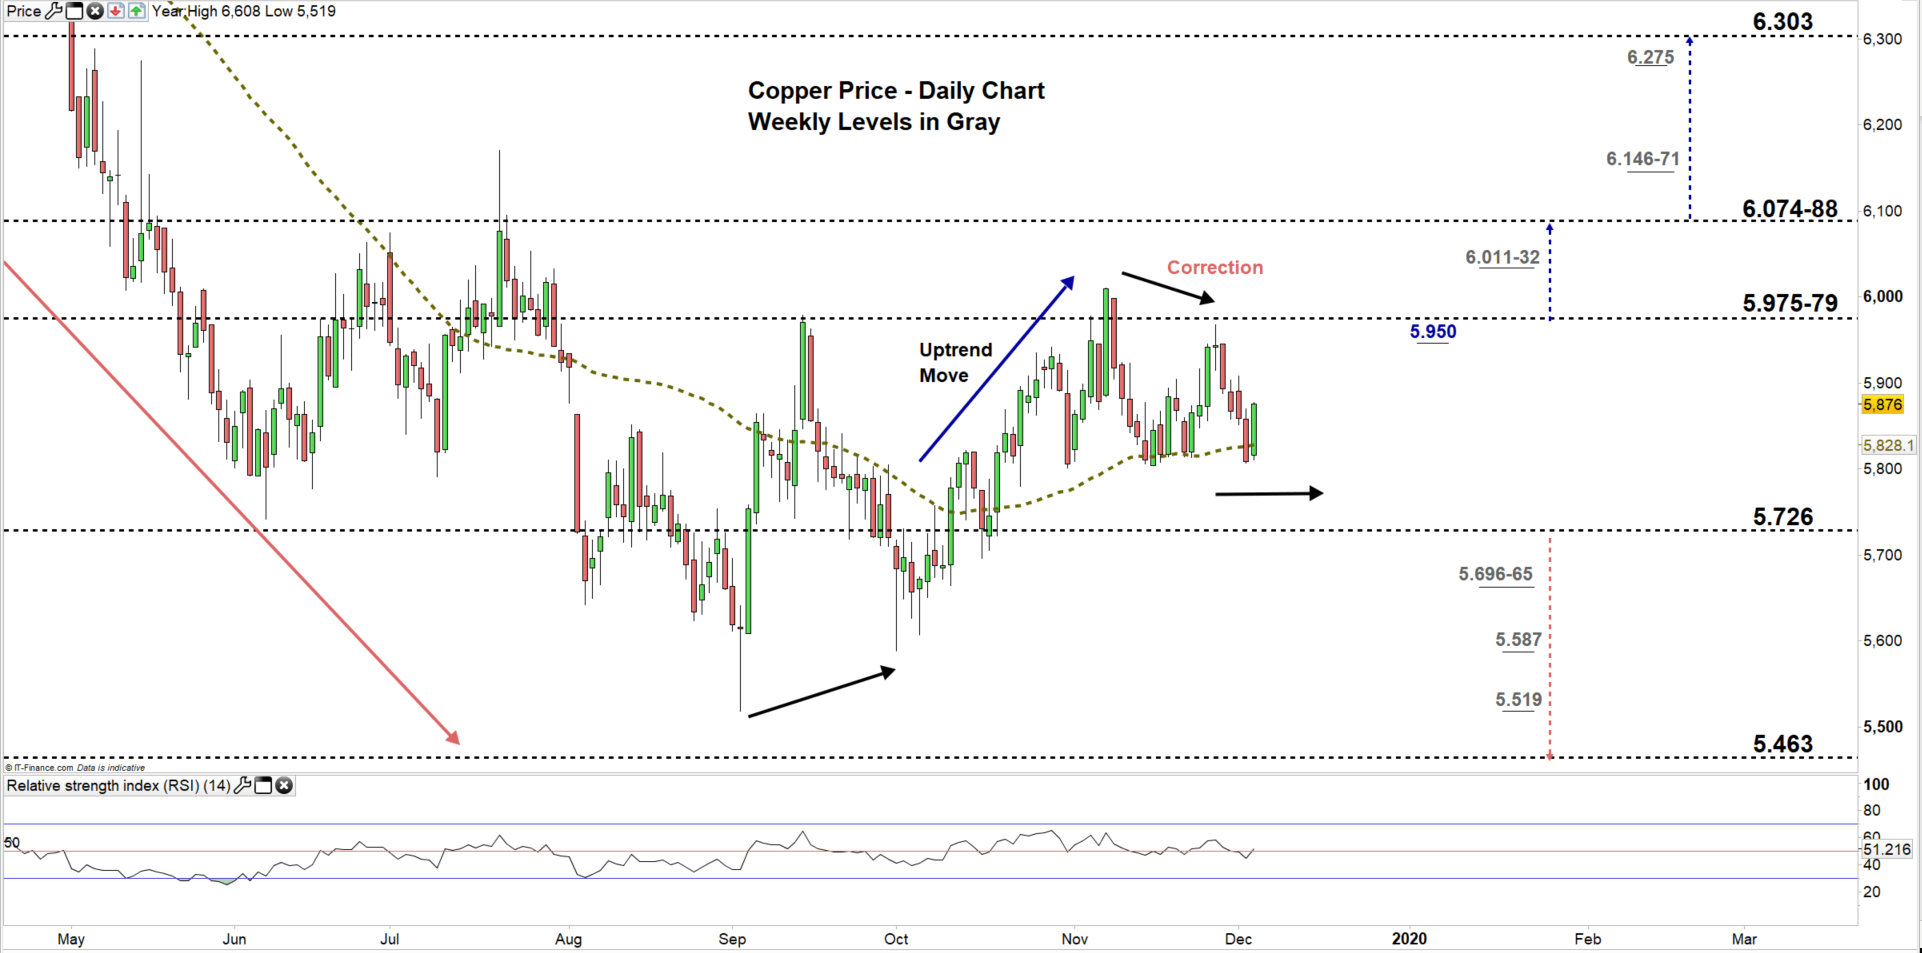
Copper DAILY PRICE CHART (May 6 – DEC 4, 2019) Zoomed In
Looking at the daily chart, we notice on Nov 8 Copper declined to a lower trading zone $5.975- $5.726 .The price found a significant support at the 50-Day average, and yet closed yesterday below the indicator.
A close below the low end of the zone could open the door for sellers to take charge and press towards $5.463. Although, downside move may weaken at the weekly support levels underscored on the chart (zoomed in) as some sellers could take profit at these points.
On the flip-side, a close above $6.079 could embolden more buyers to join the market and push towards the vicinity of $6.074-88. Nevertheless, the daily and weekly resistance level and area marked on the chart should be considered.
Just getting started? See our Beginners’ Guide for FX traders
CoPper Four-HOUR PRICE CHART (Aug 6 – DEC 4, 2019)

From the four-hour chart, we notice that yesterday Copper rebounded nearby the neckline of head and shoulders pattern .The pattern eyes sending the price towards $5.588 contingent on breaking and remaining below the neckline located at $5.804.
A break below the neckline could press Copper towards of the low end of the current trading zone discussed on the daily chart. Although, the daily support level underline on the chart should be watched closely. On the other hand, a break above $5.924 could cause a rally to the other side i.e. towards the high end of the zone. In that scenario, the resistance level at $5.950 handle should be kept in focus.
Join Me on Friday, DEC 6 at 14:00 GMT. In this session we will talk about most common directional and momentum indicators and how to use them
Written By: Mahmoud Alkudsi
Please feel free to contact me on Twitter: @Malkudsi


