


Natural Gas Technical Analysis
- Natural Gas price action
- NG Charts and analysis
Did we get it right with our Gold and Crude Oil forecasts? Find out more for free from Q4 main currencies and commodities forecasts
Natural Gas – Bullish Development
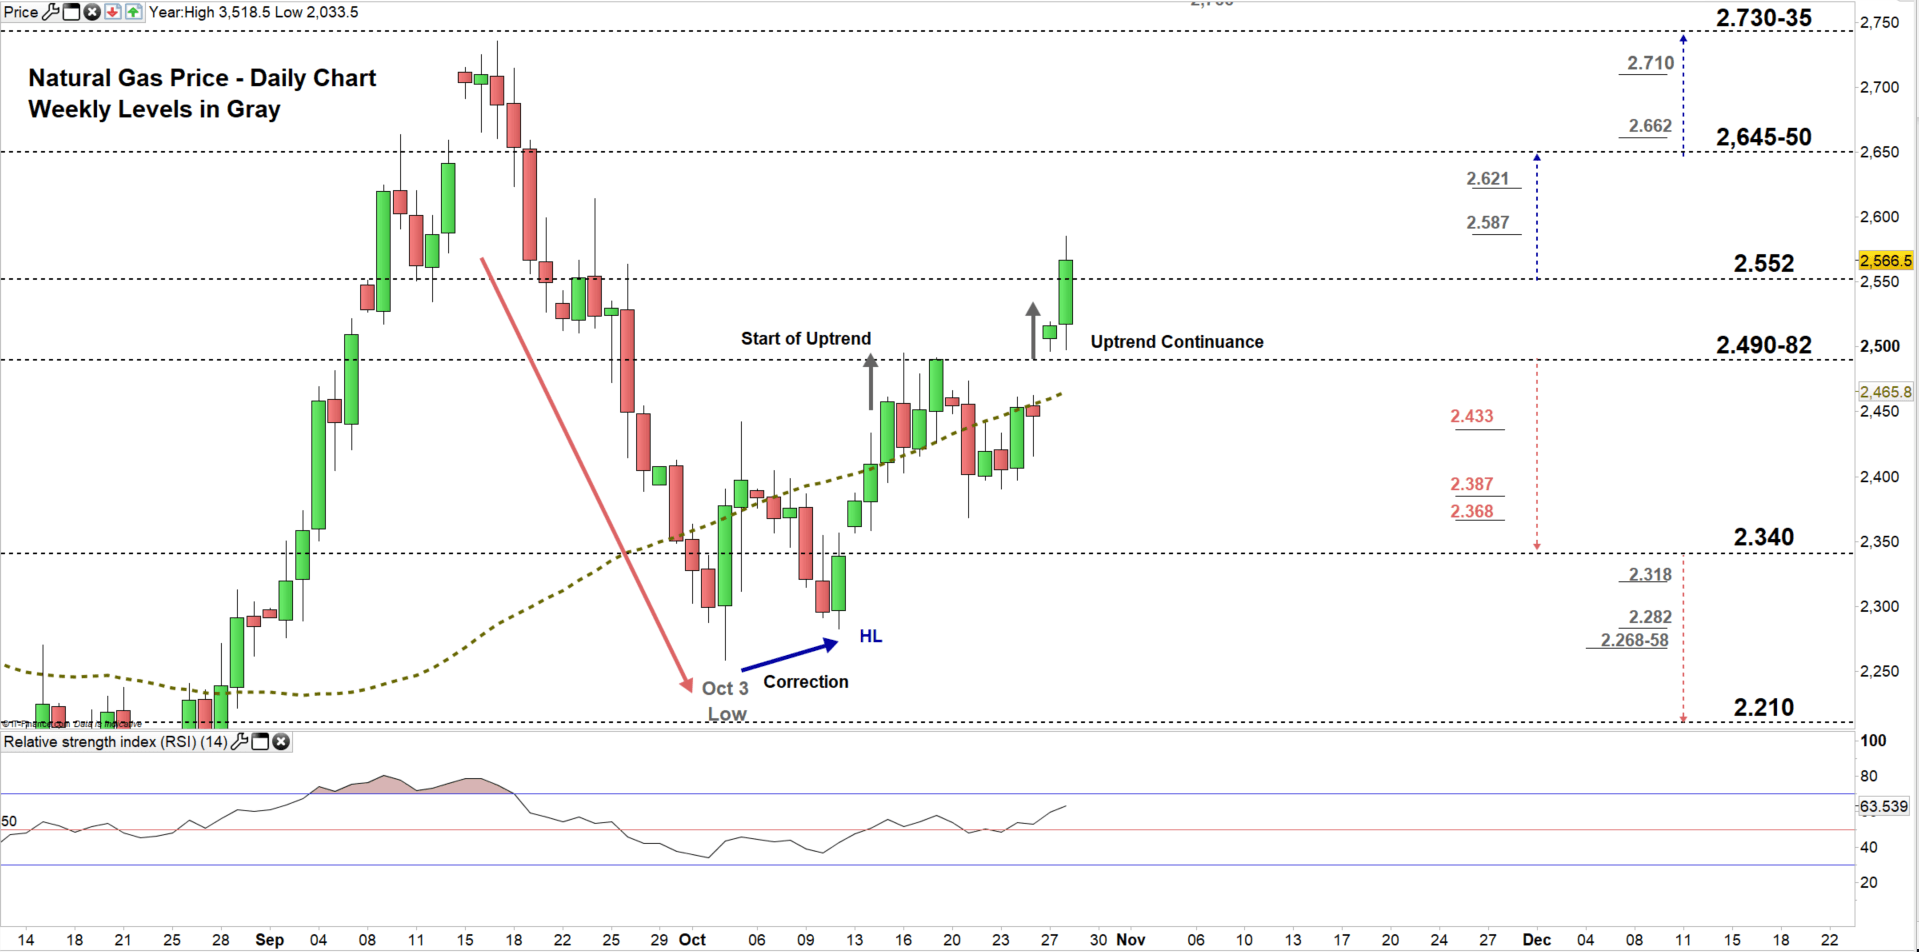
On Oct 11, Natural gas corrected higher creating a higher low at $2.282. Since then, buyers took the initiative and started on Oct 16 uptrend move with a higher high at $2.495.
Alongside this, the relative Strength Index (RSI) crossed above 50 highlighting the seller’s weakness and the start of uptrend momentum.
Having trouble with your trading strategy? Here’s the #1 Mistake That Traders Make
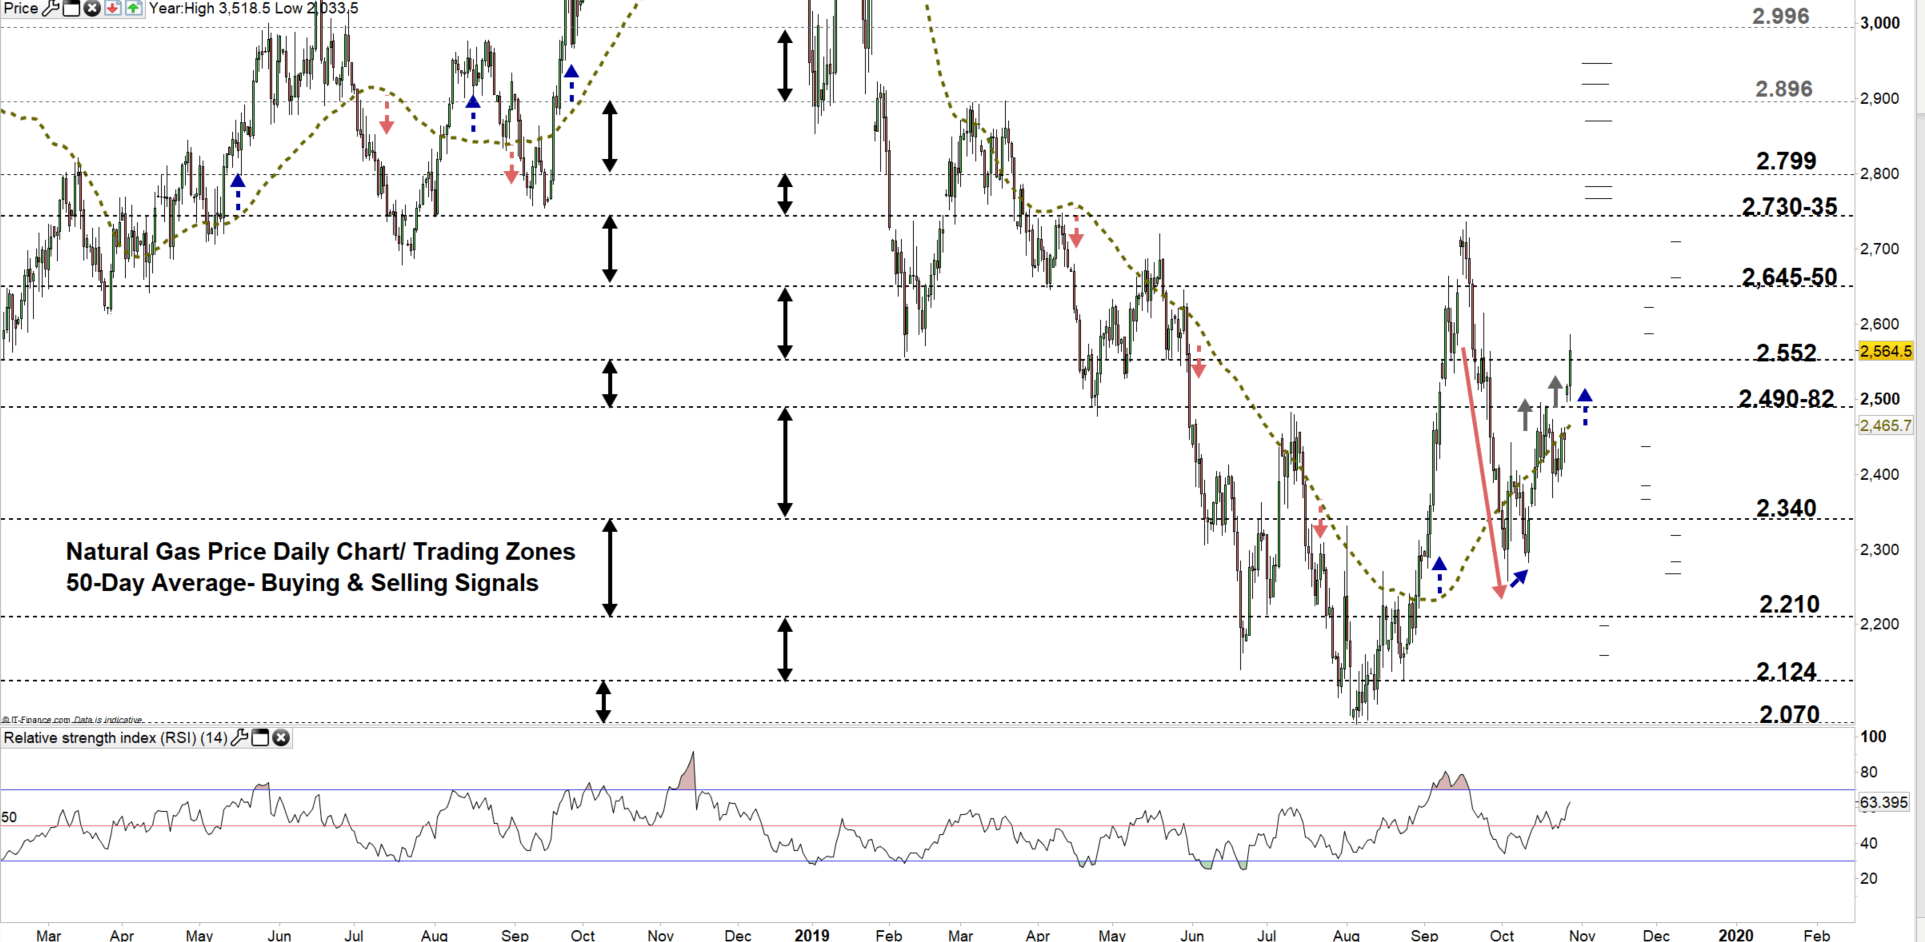
Nat-Gas DAILY Price CHART (Jan 15, 2018 – Oct 28, 2019) Zoomed Out
Nat-Gas DAILY Price CHART (Aug 27 – Oct 28, 2019) Zoomed IN
Looking at the daily chart, we notice today Natural gas opened this week with upward gap, breaking above 50 -day average and generating a bullish signal. Currently, the price tests a higher trading zone $2.552 – 2.645.
Hence, if natural gas closes today above the low end of the zone, this could embolden buyers to push towards the high end. Further close above $2.650 could cause a rally towards the vicinity of $2.730-35. Nevertheless, the weekly resistance levels underlined on the chart (zoomed in) should be watched along the way.
Having said that, any failure in closing above the low end of the zone would mean buyer’s hesitation. This opens the door to the price to correct lower towards the vicinity of $2.490-82. Further close below $2.482 may press natural gas towards $2.340. In that scenario, the daily support levels marked on the chart should be kept in focus.
Just getting started? See our Beginners’ Guide for FX traders
Natural Gas price Four-Hour PRICE CHART (Sep 17 – Oct 28, 2019)
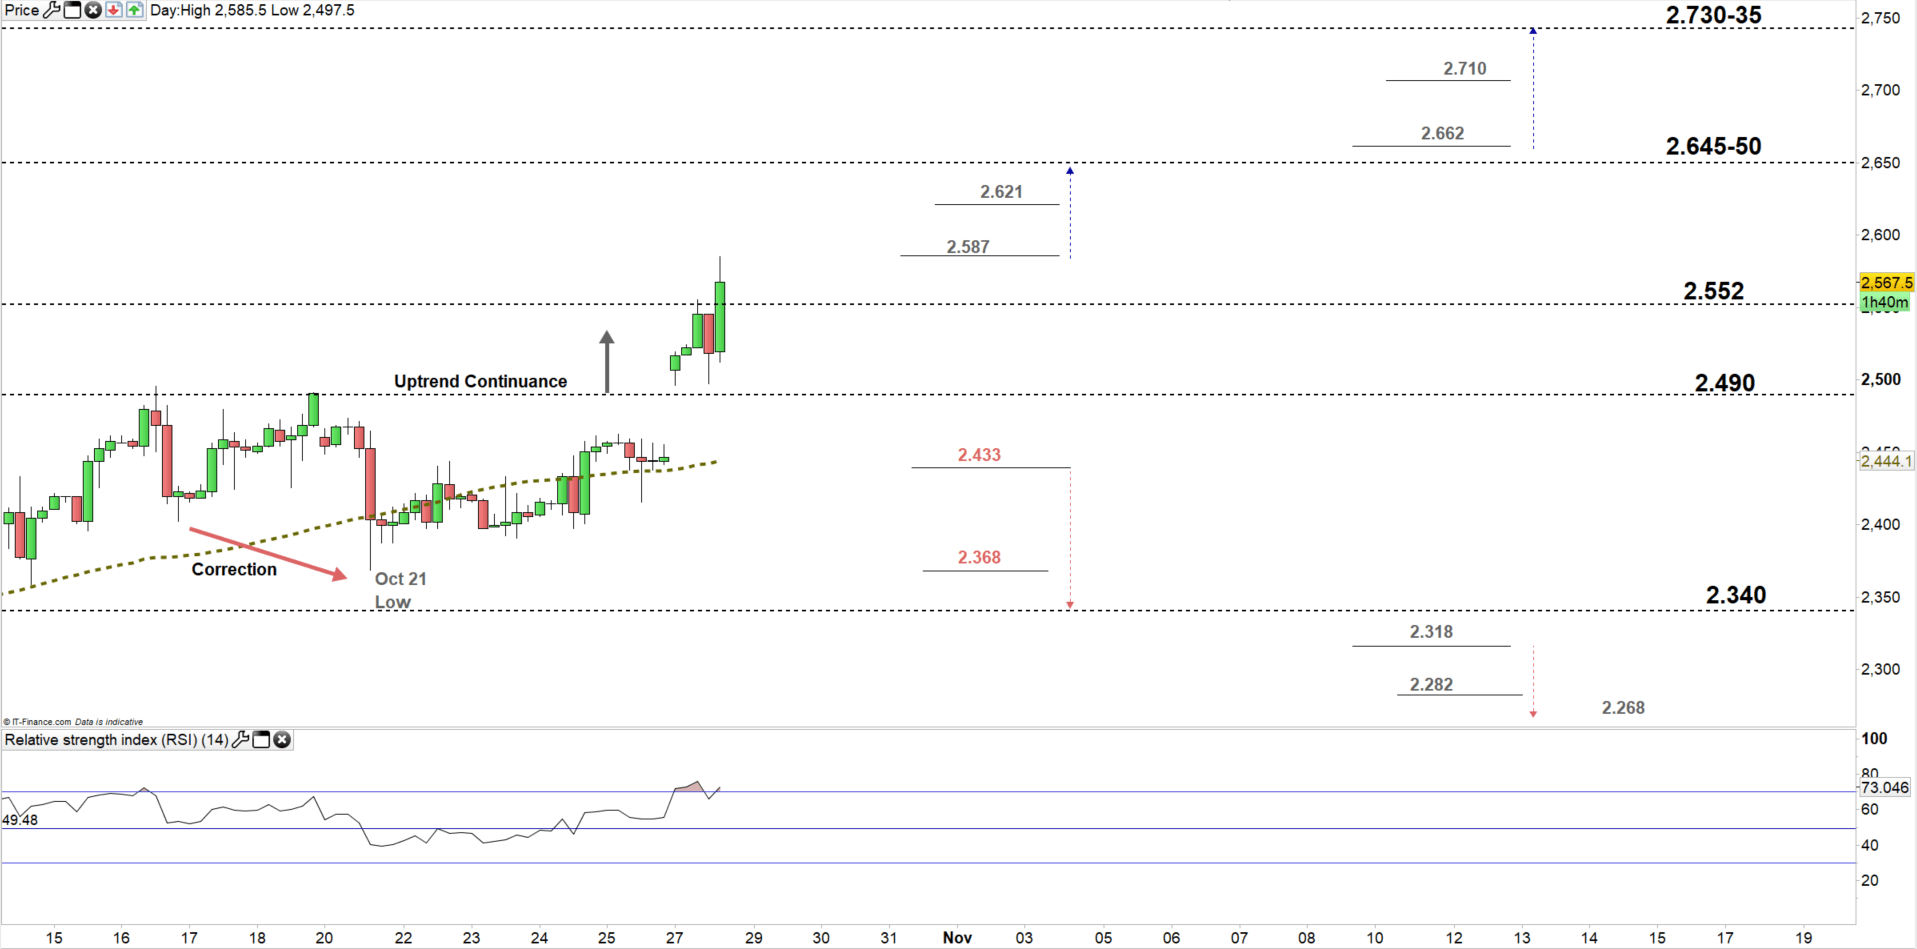
From the four- hour chart, we notice at the start of the week Natural gas’s buyers resumed bullish price action leading the price to its highest level in over four weeks.
Thus, a break above $2.587 could push the price towards the vicinity of $2.645-50. Although, the weekly resistance level underscored on the chart should be monitored. On the other hand, any break below $2.433 may correct the price lower towards $2.340. However, the daily support level underlined on the chart should be considered.
See the chart to know more about key levels to monitor in a further bullish/bearish move.
Written By: Mahmoud Alkudsi
Please feel free to contact me on Twitter: @Malkudsi


