


Bitcoin Price Technical Forecast
Check out our Q3 USD and Gold forecasts . Download for free main currencies and commodities trading guides.
BTC/USD – The Outlook Still Bearish
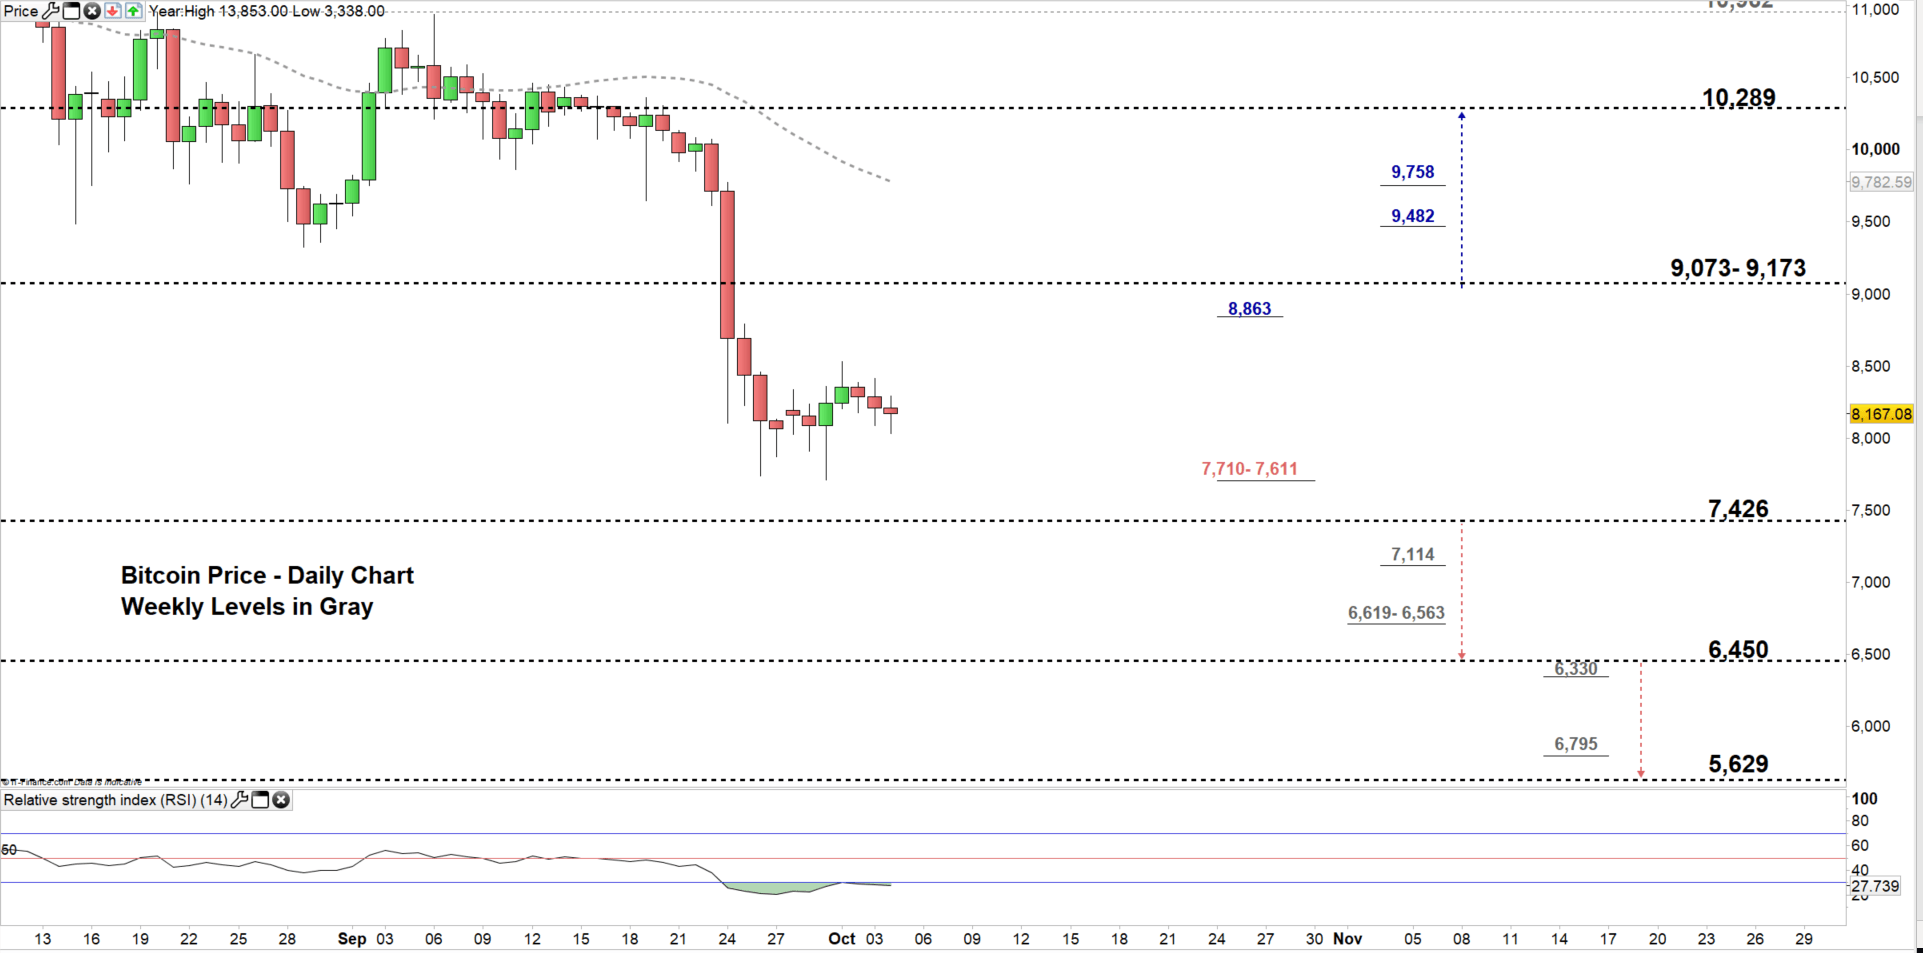
On Sep 24, Bitcoin downtrend accelerated and led the crypto currency towards 7,710 – its lowest level in over two and a half months. However, the price rallied after and settled above 8,000 handle.
Alongside this, the Relative Strength Index (RSI) dipped below 30 and failed on Tuesday to abandon oversold territory highlighting the strength of the downtrend momentum.
Just getting started? See our Beginners’ Guide for FX traders
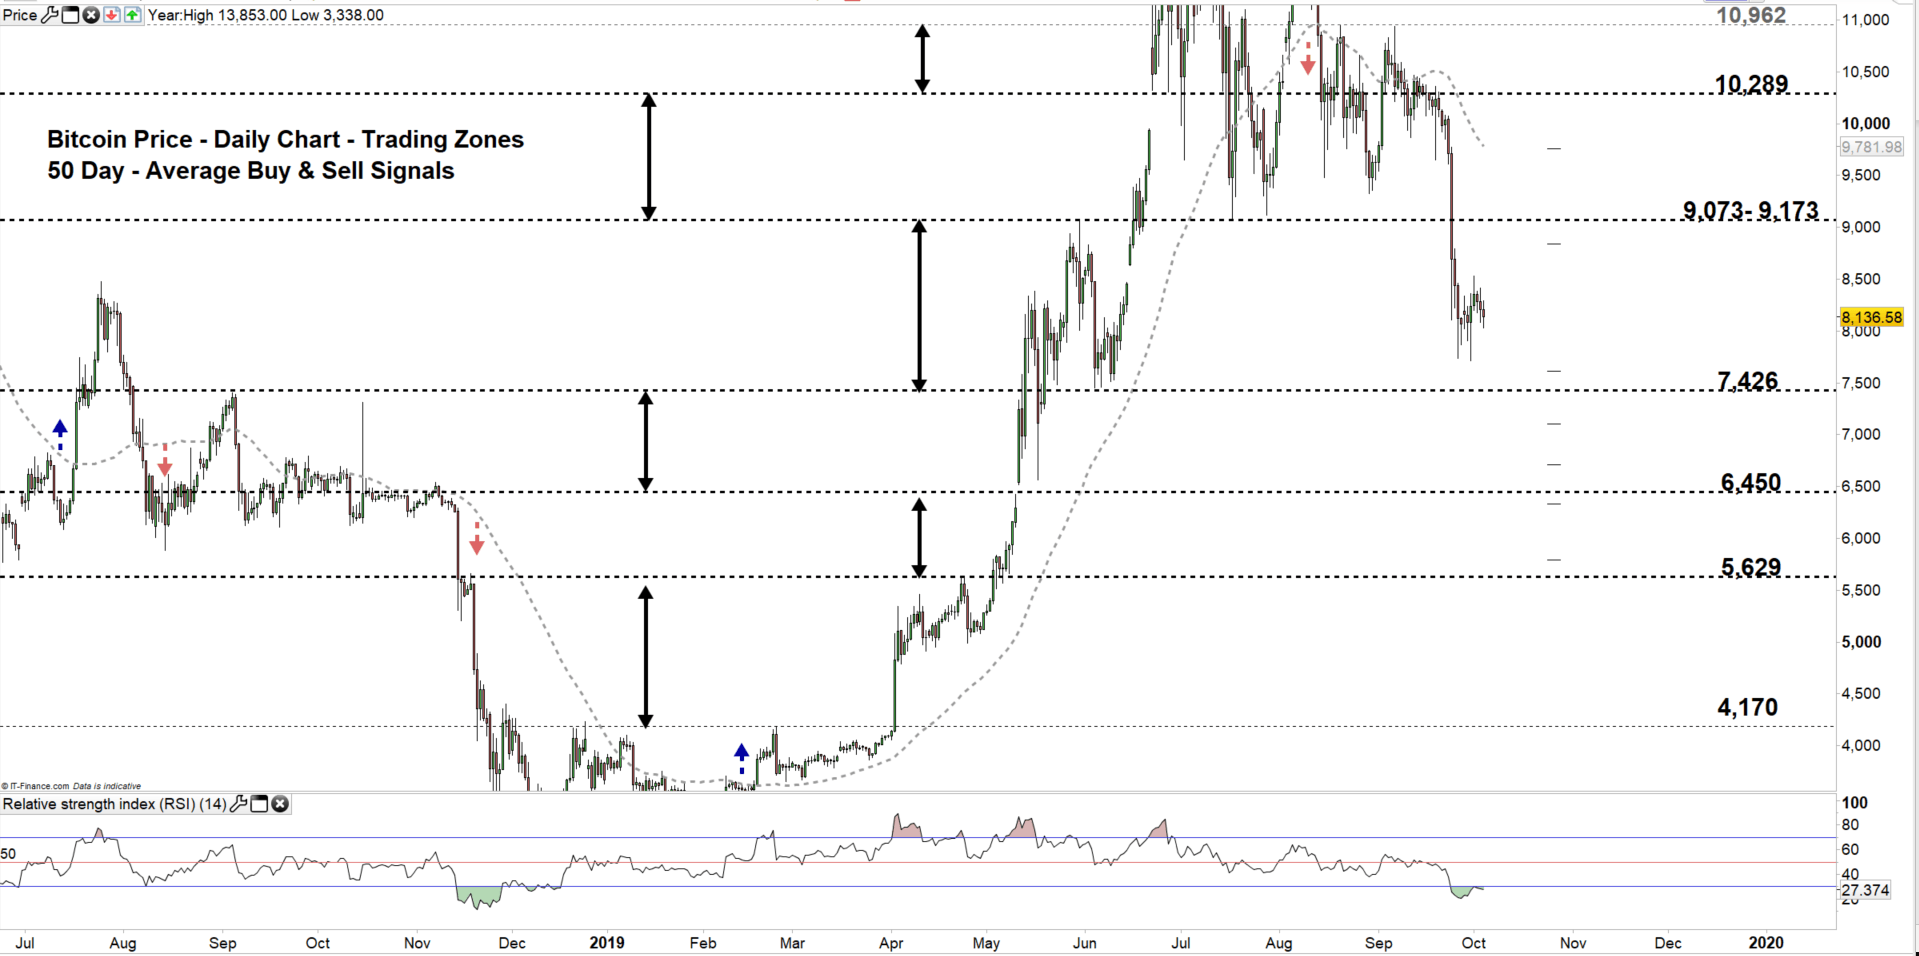
Bitcoin PRICE DAILY CHART (June 24, 2018 – Oct 04, 2019) Zoomed Out
Bitcoin PRICE DAILY CHART (Sep 13 – Oct 4, 2019) Zoomed In
Looking at the daily chart, we notice on Sep 24 BTC/USD declined to a lower trading zone 7,426 - 9,073 eyeing a test of the low end of it.
Hence, a close below the low end could press BTC/USD towards 6,450. Further close below this level could send Bitcoin even lower towards 5,629. In that scenario, the weekly support area and levels marked on the chart (zoomed in) should be kept in focus.
That said, any failure at closing below the low level of the zone could reverse the price’s direction, sending BTC/USD towards the high end of the zone. Further close above the high end may push the price towards 10,289. Nonetheless, the daily resistance levels underscored on the chart should be watched along the way.
Having trouble with your trading strategy? Here’s the #1 Mistake That Traders Make
Bitcoin PRICE FOUR Hour CHART (Sep 13 – OCt 4, 2019)
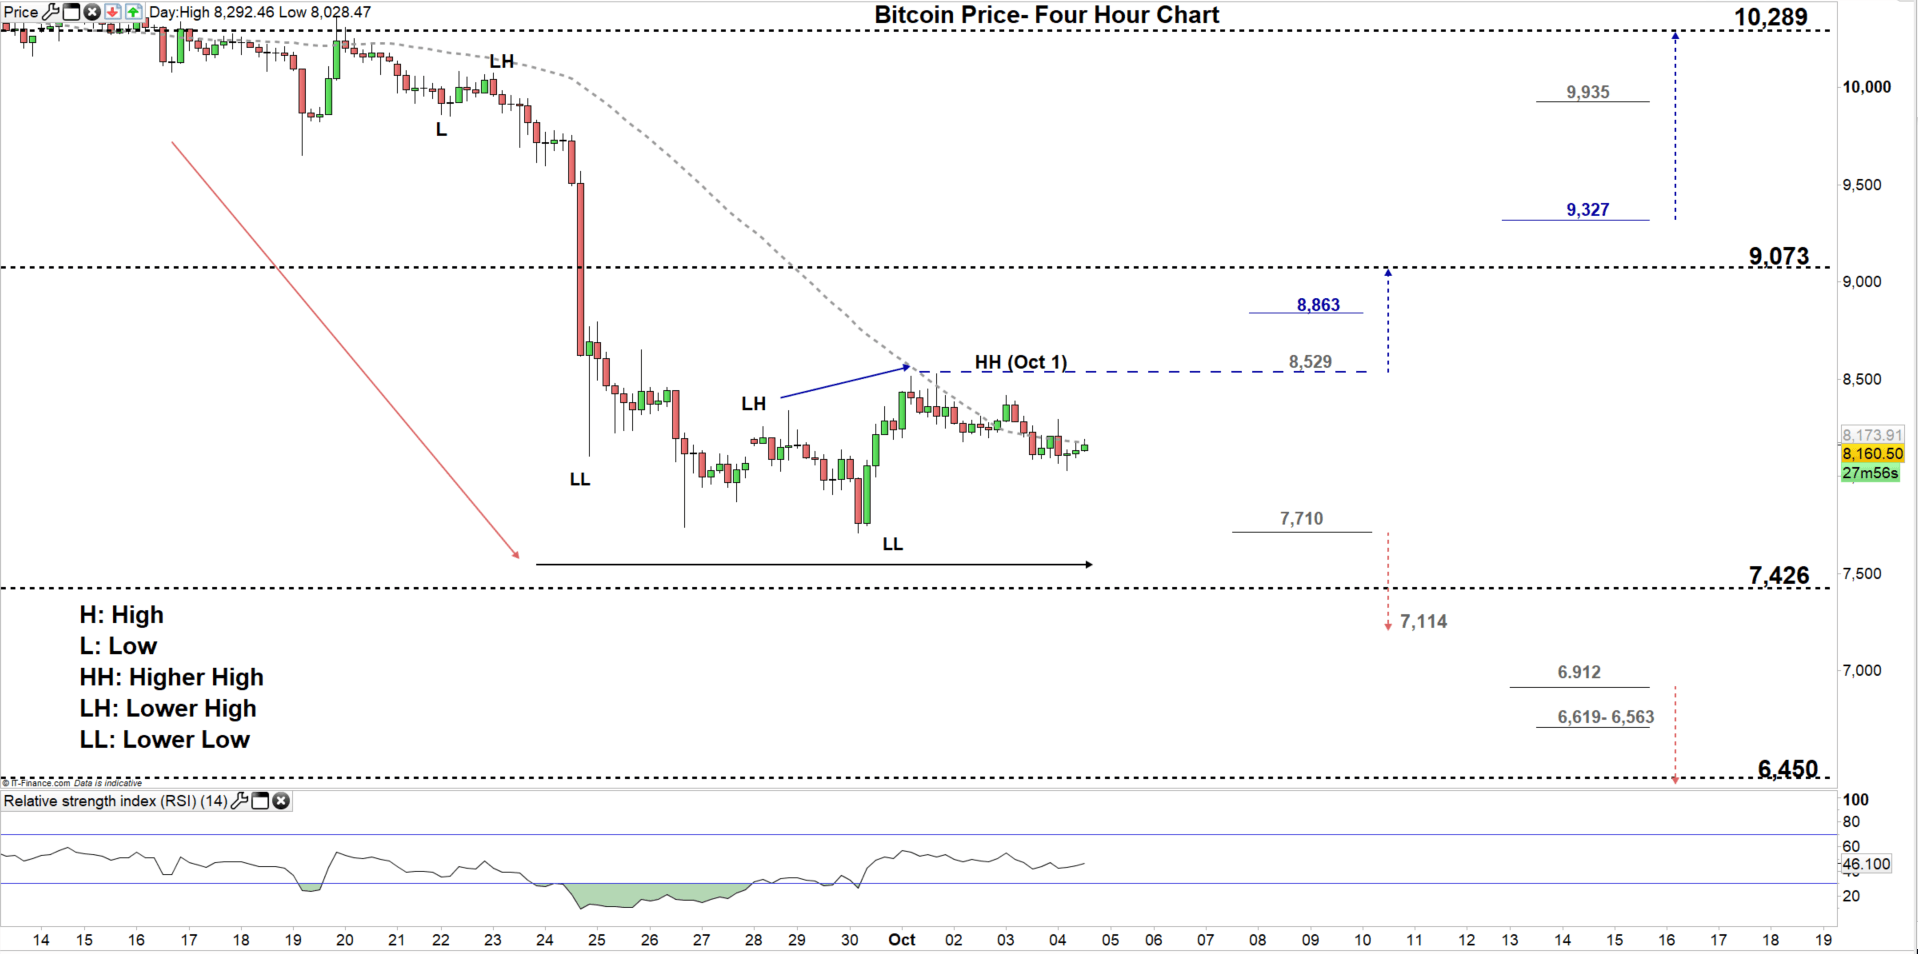
Looking at the four-hour chart, we notice on Tuesday Bitcoin corrected higher creating a higher high at 8,529. Therefore, any break above this level could send BTC/USD towards the high end of current trading zone. Although, the daily resistance level underlined on the chart should be considered.
On the other hand, any break below 7,710 could resume bearish price action towards 7,114. However, the low end of the current trading zone should be monitored.
See the chart to know more about the critical levels in a further bearish/ bullish move.
Written By: Mahmoud Alkudsi
Please feel free to contact me on Twitter: @Malkudsi


