


Crude Oil Technical Forecast
- Brent oil price charts and analysis
- Crude Oil price action
Have you seen our newest trading guides for USD, EUR and Gold ? Download for free our latest forecasts
Brent Oil – Bearish Development
Last week, crude oil printed $71.03 PB – its highest level in nearly four months. However, the price slipped below $65.00 handle then closed the weekly candlestick with a 7.0% loss. This week, sellers continued pressing Brent oil lower emphasizing the bearish outlook of the price.
Alongside this, the Relative Strength Index (RSI) remained flat nearby 55. This week, the oscillator crossed below 50 indicating to the start of downtrend momentum.
Just getting started? See our Beginners’ Guide for FX traders
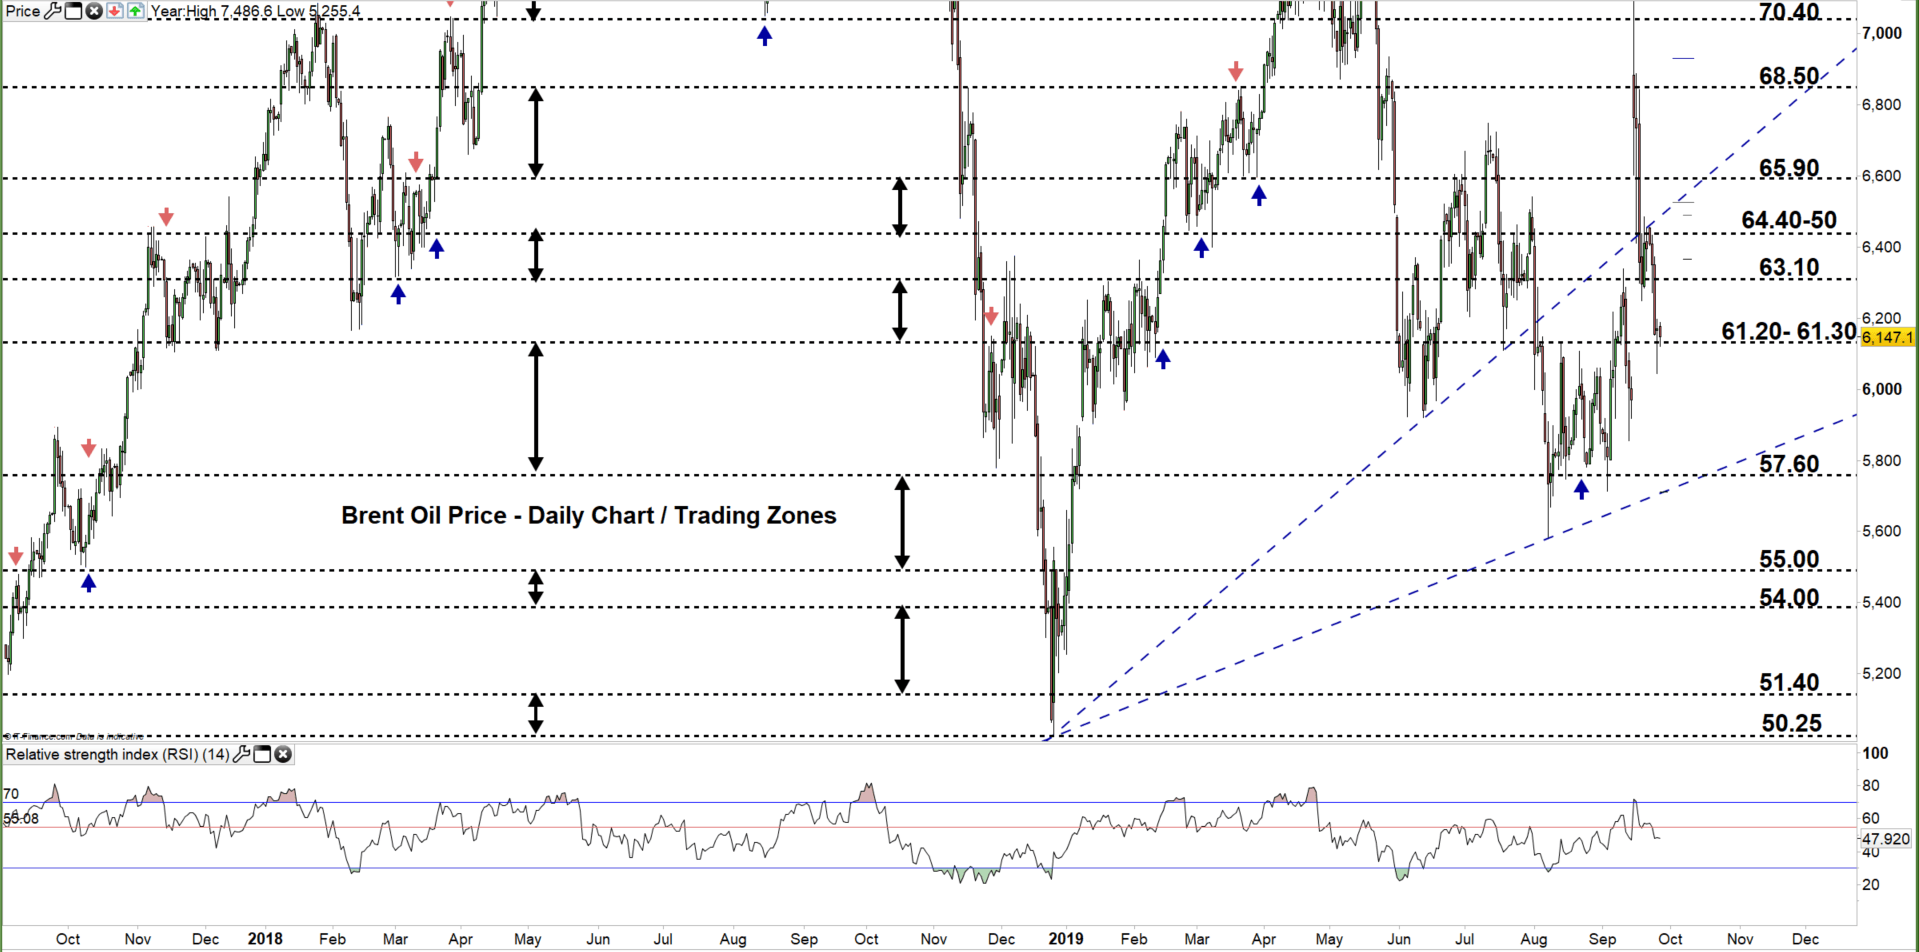
Brent Oil DAILY PRICE CHART (Jan 15, 2018 – SEP 26, 2019) Zoomed Out
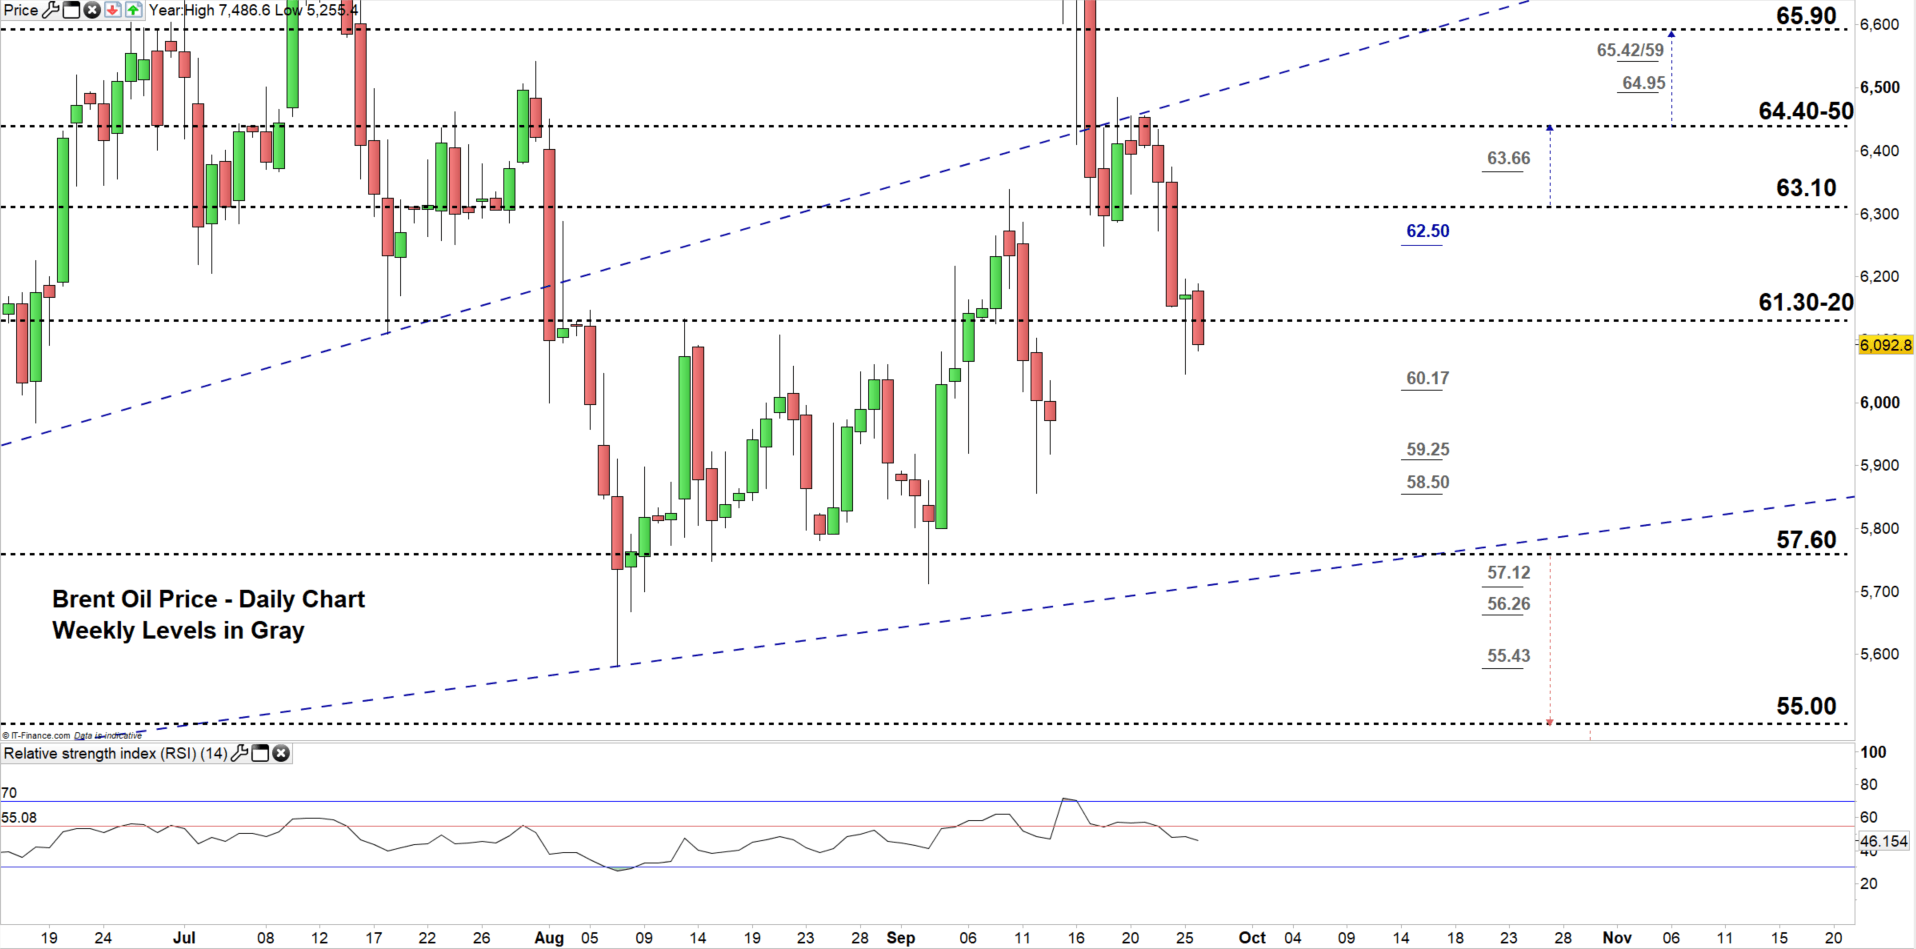
Brent Oil DAILY PRICE CHART (June 11 – Sep 26, 2019) Zoomed In
From the daily chart, we notice on Monday crude oil tested trading below $63.00 handle and in the following day declined to a lower trading zone $61.20- $63.10.
Thus, any successful close below the low end of the of the zone could send Brent crude towards $57.60. That said, the weekly support levels underlined on the chart (zoomed in) should be kept in focus. See the chart to know more about the lower trading zone with the weekly support level Brent oil would encounter in a further bearish move.
On the other hand, a close above the high end of the zone could push the price towards the vicinity of $64.40-50. Although, the weekly resistance level underscored on the chart needs to be considered.
Having trouble with your trading strategy? Here’s the #1 Mistake That Traders Make
Brent Oil Four Hour PRICE CHART (Sep 1 – Sep 26, 2019) Zoomed In
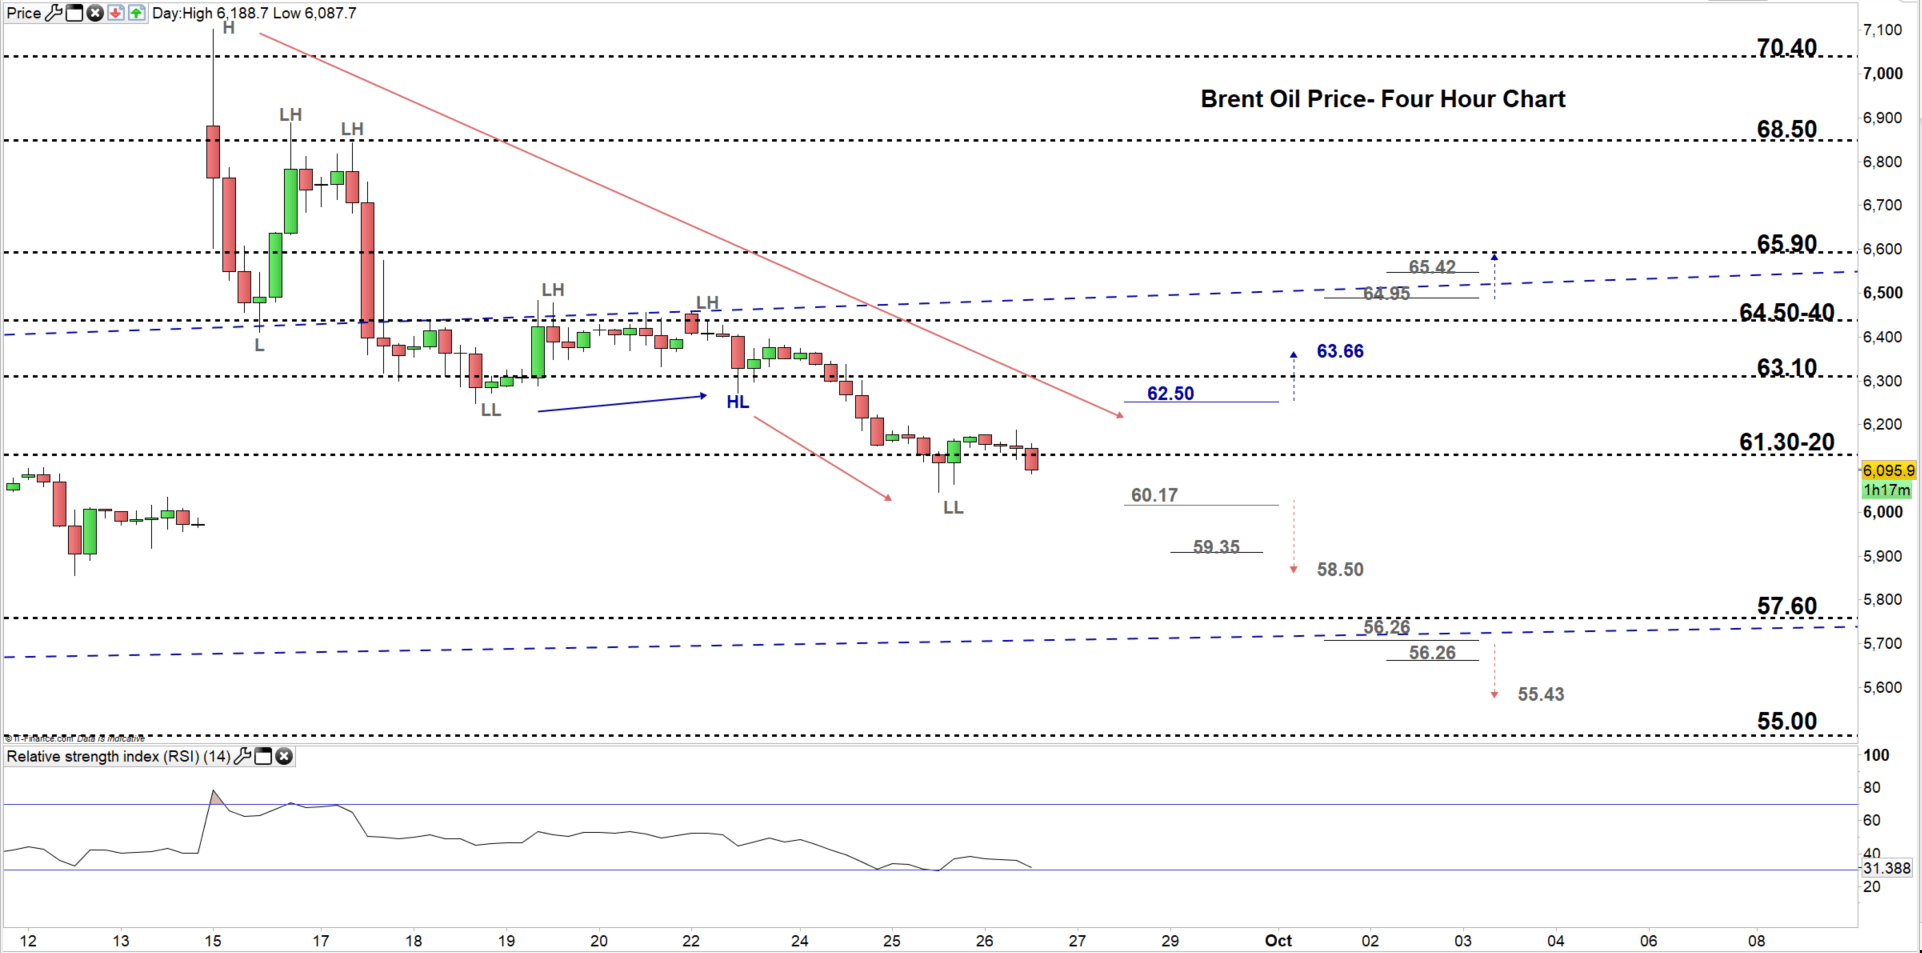
Looking at the four-hour chart, we notice on Sep 15 crude oil started a downtrend move creating lower highs with lower lows. On Sep 23, the price corrected higher creating a higher low at $62,72. However, Brent crude resumed bearish price action and created yesterday a lower low at $60.44.
Hence, a break below $60.17 could press the price towards $58.50. However, the weekly support level underscored on the chart needs to be monitored.
On the flip-side, any break above $62.50 could push Brent crude towards $63.66. Nonetheless, the high end of the aforementioned trading zone would be worth monitoring.
Written By: Mahmoud Alkudsi
Please feel free to contact me on Twitter: @Malkudsi


